
Which day sees the most home cooking fires: Thanksgiving, Christmas Eve or Christmas Day?
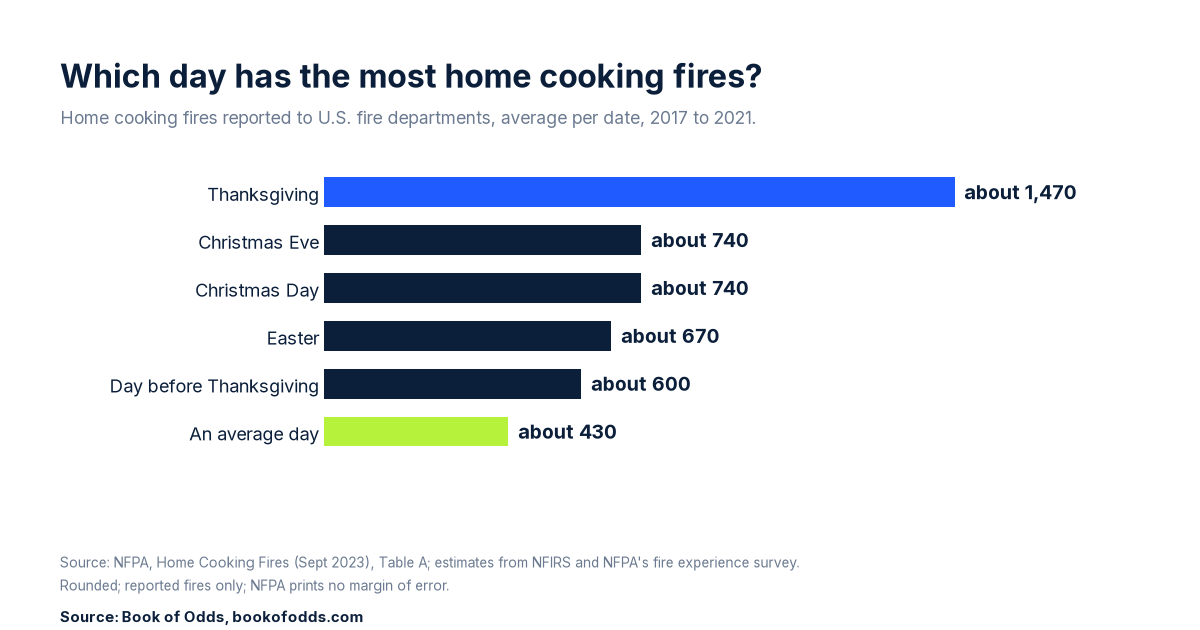
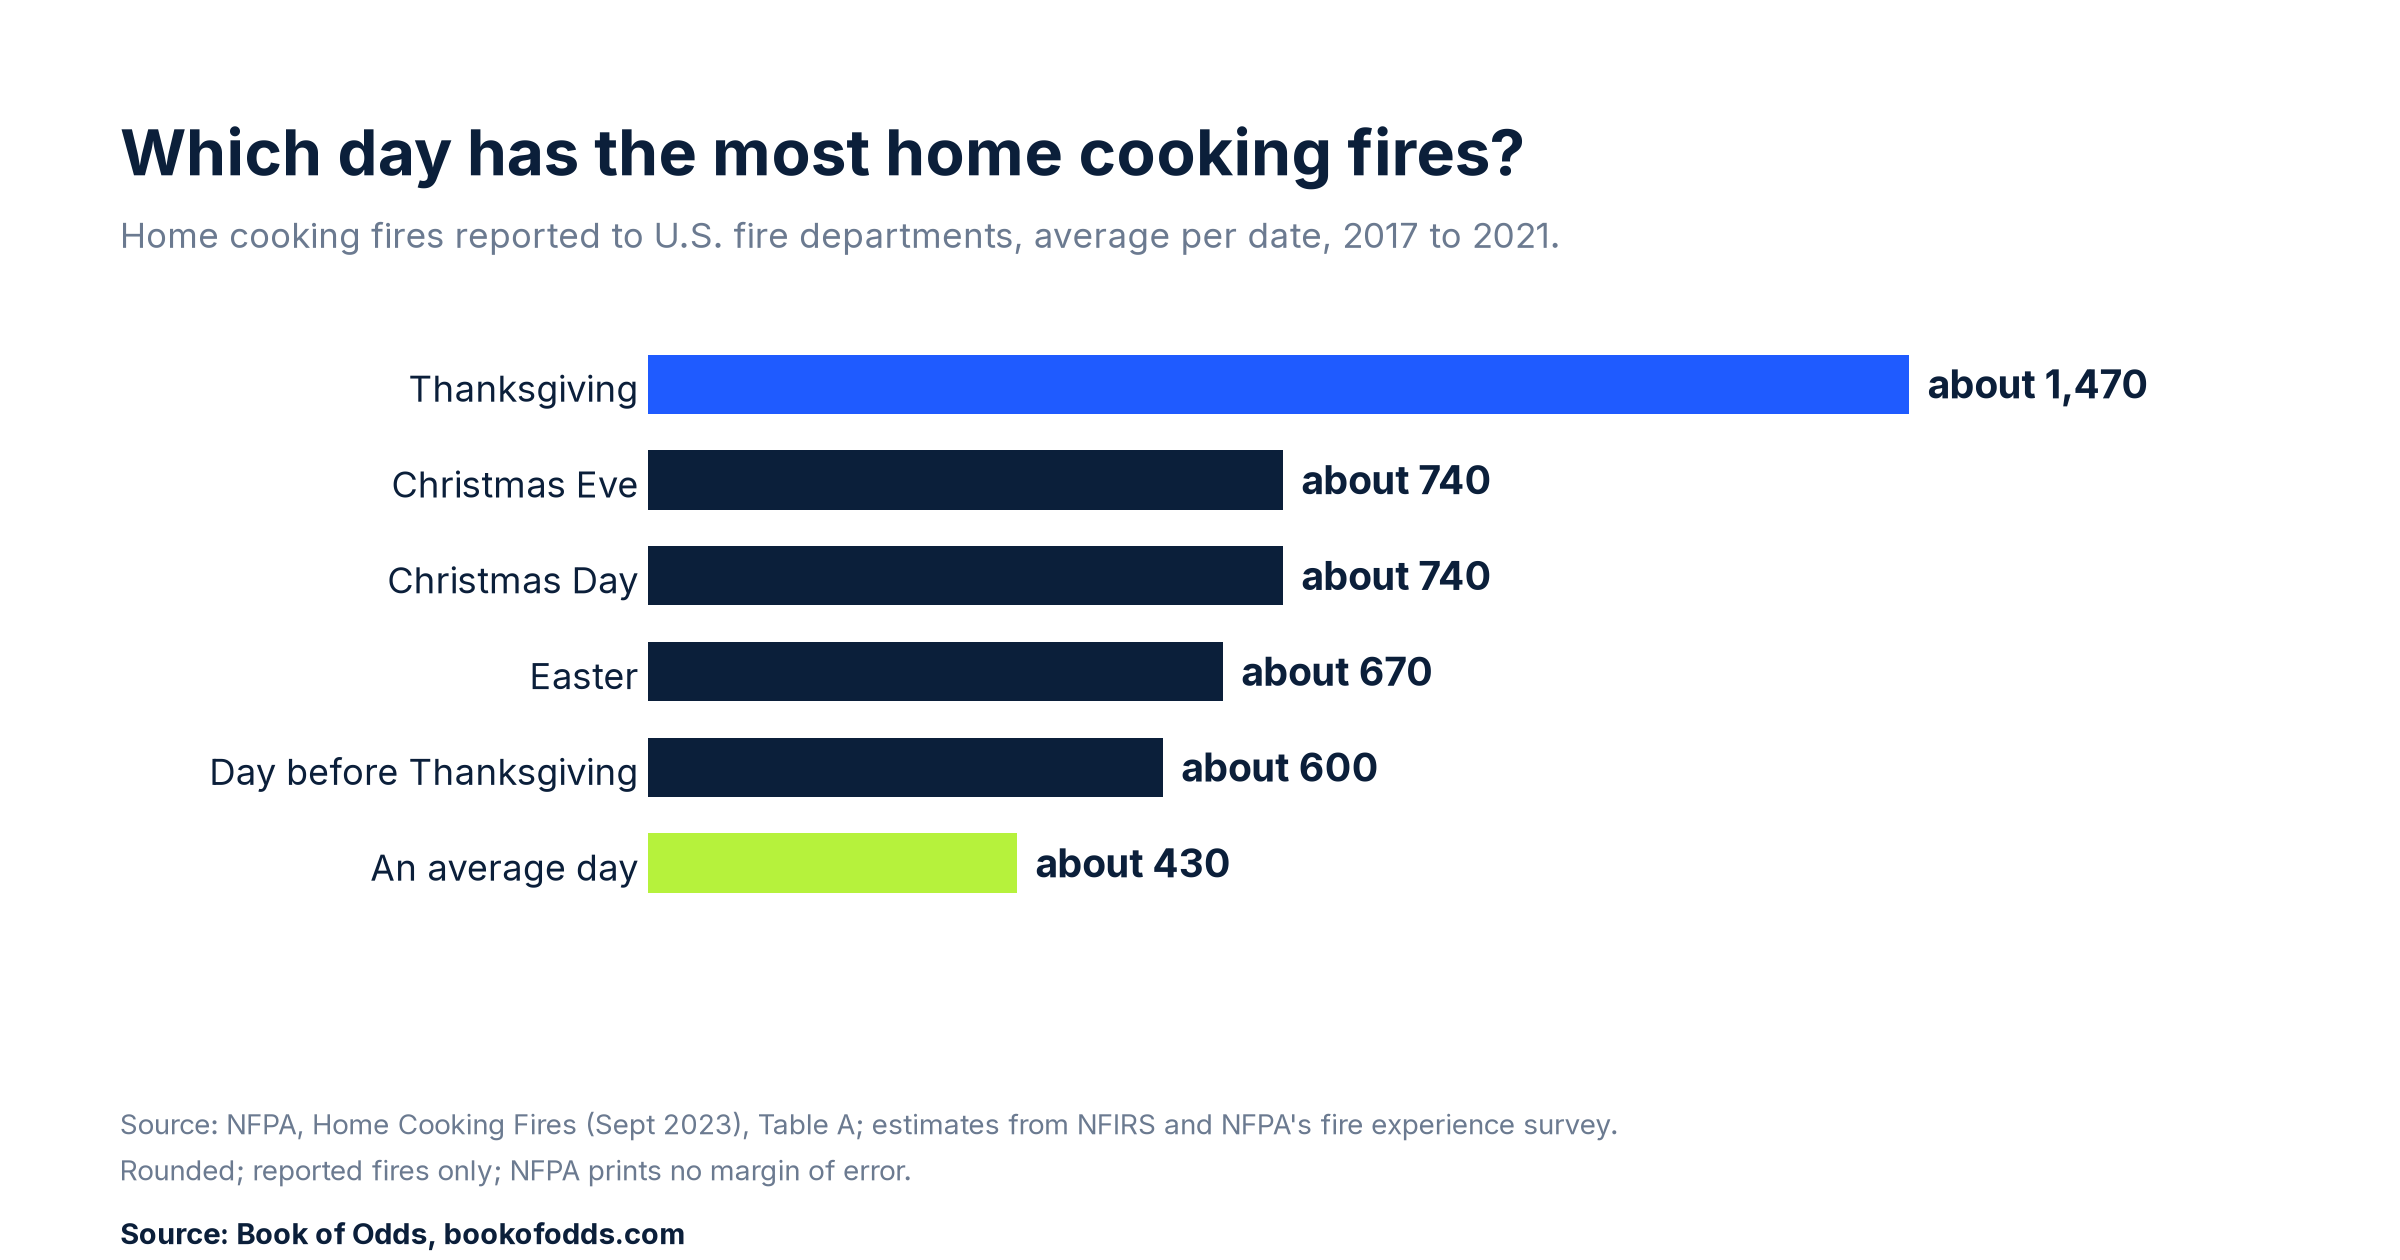
Thanksgiving, and it is not close. In NFPA’s 2017 to 2021 averages, about 1,470 home cooking fires were reported to U.S. fire departments on Thanksgiving, against about 740 on Christmas Eve, about 740 on Christmas Day and about 430 on an average day.
Pick your day
Imagine the turkey is in, the timer is set, and the doorbell rings for the third time. Somebody needs a coat taken, somebody wants a drink, and somebody wants to explain their commute. Now pick the holiday with the most home cooking fires reported to fire departments. Make your pick, then read on.
The number that carries the piece: 1,470
The National Fire Protection Association (NFPA) estimates home cooking fires from two sources: the federal fire incident database (NFIRS) and NFPA’s own annual survey of fire departments. In its Home Cooking Fires report of September 2023, NFPA lists the average number of home cooking fires reported to U.S. fire departments on its leading dates, 2017 to 2021. “Home” means one- and two-family houses, manufactured homes, and apartments or other multifamily housing. NFPA’s own summary: Thanksgiving is “by far the leading day.”
| Day | Home cooking fires reported, average per date, 2017 to 2021 |
|---|---|
| Thanksgiving | about 1,470 |
| Christmas Eve | about 740 |
| Christmas Day | about 740 |
| Easter | about 670 |
| Day before Thanksgiving | about 600 |
| An average day | about 430 |
These are rounded NFPA estimates of fires that were reported to fire departments. NFPA labels the Thanksgiving row “November 22 (Thanksgiving),” but the holiday moves from year to year, so we read the row as the holiday’s average, not one calendar date. That reading is ours.
The twist: how big the gap is
Thanksgiving has about twice as many reported fires as Christmas Eve or Christmas Day (1,470 divided by 740 is about 2.0). Against an average day it has about 3.4 times as many (1,470 divided by 430 is about 3.4, from NFPA’s rounded figures). NFPA prints the same gap as “240 percent above” the average day. We use “times” so every comparison stands on one footing.
Here is the dinner-table version. Spread evenly over 24 hours, 1,470 fires is about one reported fire every minute (1,440 minutes divided by 1,470). An average day works out to about one every three minutes (1,440 divided by 430). Real days are not even, so treat that as a way to picture the average and nothing more. One Thanksgiving holds about as many reported home cooking fires as 3.4 average days. All of these ratios are our arithmetic from NFPA’s rounded figures.
The quiet places behind it
The day before Thanksgiving comes in at about 600, which NFPA puts at 40% above an average day. Easter takes fourth place in NFPA’s table, at about 670. Christmas Eve and Christmas Day both show about 740 in NFPA’s table, about 1.7 times an average day (740 divided by 430 is about 1.7).
What this does not tell you
It does not count kitchens or households. It counts fires reported to fire departments, and the report says nothing about fires that were never reported. Most of the reported ones were small: NFPA says 80% of home cooking fires in 2017 to 2021 were confined to the object or pan where they started.
It is an average of five years, so any one Thanksgiving can come in higher or lower. NFPA does not print a margin of error for these single-date estimates. NFPA has since published single-year Thanksgiving counts, in a news release dated Nov. 11, 2025 and on its Thanksgiving page, on a different basis from the five-year averages; this piece uses the five-year averages in the 2023 report. And because we used no count of households, it says nothing about the chance that any one household has a fire. For a different accident risk counted on this site, see the increasing risk of unintentional poisoning.
Why Thanksgiving
NFPA says unattended cooking was by far the leading factor in cooking fires in 2017 to 2021. Beside its table, NFPA adds that cooking increases during holiday celebrations, and that guests, television and other activities can distract attention from the kitchen. NFPA does not test that explanation against the table, so we pass it along as NFPA’s reading, not a finding. On its Thanksgiving page, NFPA’s advice is to stay in the kitchen when cooking on the stove top. Cooking was also the leading cause of reported home fires in NFPA’s 2017 to 2021 report. For the leading causes of accidental death overall, see top 5 accidental deaths. For another measure of the Thanksgiving kitchen rush, see how busy the Butterball Turkey Talk-Line gets.
So, which day?
Thanksgiving: about 1,470 reported home cooking fires on the average Thanksgiving, against about 430 on an average day. That is about 3.4 times as many, counted the same way.
Sources and method
- NFPA, “Home Cooking Fires,” Shelby Hall and Tucker McGree, September 2023 (data 2017 to 2021), Table A, “Leading Dates on Average.” Accessed Oct. 19, 2026: https://www.nfpa.org/education-and-research/research/nfpa-research/fire-statistical-reports/home-cooking-fires
- NFPA, “Thanksgiving Fire Safety Information,” accessed Oct. 19, 2026 (stove top advice): https://www.nfpa.org/education-and-research/home-fire-safety/thanksgiving
Method: ratios are our arithmetic from NFPA’s rounded figures. 1,470 divided by 740 is 1.99, shown as about 2.0. 1,470 divided by 430 is 3.42, shown as about 3.4. 740 divided by 430 is 1.72, shown as about 1.7. 1,440 divided by 1,470 is 0.98 minutes; 1,440 divided by 430 is 3.35 minutes. NFPA’s figures are rounded estimates of reported fires, built from NFIRS and its fire experience survey.
Last checked and corrections
Last checked: October 19, 2026. This article was machine-checked against the sources above and has not been expert-reviewed. Spotted an error or a newer public figure? Please tell us on our contact page with the article link and we will review it.