The Odds of a Perfect March Madness Bracket

The average Bracket Challenge player has a 1 in 120.2 billion chance of a perfect 63-game bracket, so across 36 million brackets NCAA.com tracked in 2026, one is expected about every 3,300 years.

Illustration of a pencil stub and eraser crumbs on a blank tournament bracket sheet on a wooden desk.

Last checked · Suggest a correction

1 in 120.2 billion

NCAA.com's figure for the average Bracket Challenge player: 1 in 120.2 billion for a perfect 63-game men's bracket (2026). Pure guessing: 1 in 9.2 quintillion.

per event · One NCAA Division I men's tournament bracket (63 games, First Four excluded), filled out by a typical fan · Data year 2026
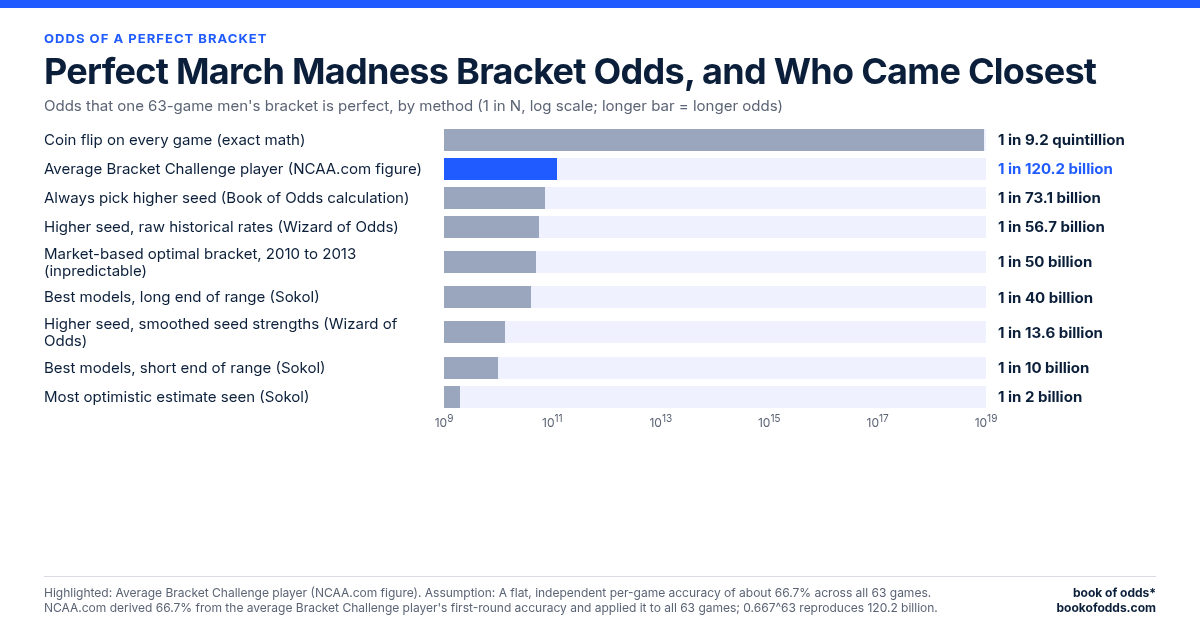
Odds that one 63-game men's bracket is perfect in a tournament, by method, as 1 in N on a log scale. Average Bracket Challenge player (NCAA.com figure): 1 in 120,200,000,000. Always pick higher seed (Book of Odds calculation): 1 in 73,100,000,000. Higher seed, raw historical rates (Wizard of Odds): 1 in 56,700,000,000. Market-based optimal bracket, 2010 to 2013 (inpredictable): 1 in 50,000,000,000. Best models, long end of range (Sokol): 1 in 40,000,000,000. Higher seed, smoothed seed strengths (Wizard of Odds): 1 in 13,600,000,000. Best models, short end of range (Sokol): 1 in 10,000,000,000. Most optimistic estimate seen (Sokol): 1 in 2,000,000,000. Mathematical model; assumptions: a flat, independent per-game accuracy of about 66.7% across all 63 games. NCAA.com derived 66.7% from the average Bracket Challenge player's first-round accuracy and applied it to all 63 games; 0.667^63 reproduces 120.2 billion.BOOK OF ODDSOdds that one 63-game men's bracket is perfectin a tournament, by method (1 in N, log scale)▶ Average BracketChallenge player (NCAA.comfigure)120,200,000,000 1 in NAlways pick higher seed(Book of Odds calculation)73,100,000,000 1 in NHigher seed, raw historicalrates (Wizard of Odds)56,700,000,000 1 in NMarket-based optimalbracket, 2010 to 2013(inpredictable)50,000,000,000 1 in NBest models, long end ofrange (Sokol)40,000,000,000 1 in NHigher seed, smoothed seedstrengths (Wizard of Odds)13,600,000,000 1 in NBest models, short end ofrange (Sokol)10,000,000,000 1 in NMost optimistic estimate seen(Sokol)2,000,000,000 1 in NLog scale (bars do not start at zero): 1,000,000,000 to 1,000,000,000,000 1 in N, each gridline ×10 ·▶ = highlightedMathematical model · A flat, independent per-game accuracy of about 66.7% across all 63 games.NCAA.com derived 66.7% from the average Bracket Challenge player's first-round accuracy andapplied it to all 63 games; 0.667^63 reproduces 120.2 billion.
Odds that one 63-game men's bracket is perfect in a tournament, by method, as 1 in N on a log scale. Average Bracket Challenge player (NCAA.com figure): 1 in 120,200,000,000. Always pick higher seed (Book of Odds calculation): 1 in 73,100,000,000. Higher seed, raw historical rates (Wizard of Odds): 1 in 56,700,000,000. Market-based optimal bracket, 2010 to 2013 (inpredictable): 1 in 50,000,000,000. Best models, long end of range (Sokol): 1 in 40,000,000,000. Higher seed, smoothed seed strengths (Wizard of Odds): 1 in 13,600,000,000. Best models, short end of range (Sokol): 1 in 10,000,000,000. Most optimistic estimate seen (Sokol): 1 in 2,000,000,000. Mathematical model; assumptions: a flat, independent per-game accuracy of about 66.7% across all 63 games. NCAA.com derived 66.7% from the average Bracket Challenge player's first-round accuracy and applied it to all 63 games; 0.667^63 reproduces 120.2 billion.BOOK OF ODDSOdds that one 63-gamemen's bracket is perfect in atournament, by method (1 inN, log scale)▶ Average Bracket Challenge player(NCAA.com figure)120,200,000,000 1 in NAlways pick higher seed (Book of Oddscalculation)73,100,000,000 1 in NHigher seed, raw historical rates (Wizard ofOdds)56,700,000,000 1 in NMarket-based optimal bracket, 2010 to 2013(inpredictable)50,000,000,000 1 in NBest models, long end of range (Sokol)40,000,000,000 1 in NHigher seed, smoothed seed strengths(Wizard of Odds)13,600,000,000 1 in NBest models, short end of range (Sokol)10,000,000,000 1 in NMost optimistic estimate seen (Sokol)2,000,000,000 1 in NLog scale (bars do not start at zero): 1,000,000,000to 1,000,000,000,000 1 in N, each gridline ×10 · ▶ =highlightedMathematical model · A flat, independent per-gameaccuracy of about 66.7% across all 63 games.NCAA.com derived 66.7% from the average BracketChallenge player's first-round accuracy and appliedit to all 63 games; 0.667^63 reproduces 120.2 billion.
Mathematical model · A flat, independent per-game accuracy of about 66.7% across all 63 games. NCAA.com derived 66.7% from the average Bracket Challenge player's first-round accuracy and applied it to all 63 games; 0.667^63 reproduces 120.2 billion.
View the data table
Outcome
Average Bracket Challenge player (NCAA.com figure)120,200,000,000
Always pick higher seed (Book of Odds calculation)73,100,000,000
Higher seed, raw historical rates (Wizard of Odds)56,700,000,000
Market-based optimal bracket, 2010 to 2013 (inpredictable)50,000,000,000
Best models, long end of range (Sokol)40,000,000,000
Higher seed, smoothed seed strengths (Wizard of Odds)13,600,000,000
Best models, short end of range (Sokol)10,000,000,000
Most optimistic estimate seen (Sokol)2,000,000,000

The short answer

Guess every game like a coin flip and your chance of a perfect bracket is 1 in 2^63. That is one chance in 9,223,372,036,854,775,808, or about 1 in 9.2 quintillion, for one bracket covering the 63 games from the Round of 64 through the championship in a single tournament.

Knowing the sport helps a lot. It just doesn’t help enough. NCAA.com puts the average Bracket Challenge player (which we call the typical fan) at 1 in 120.2 billion. Picking the higher seed in every game gives about 1 in 73.1 billion by our calculation. The best published models, per Sokol and inpredictable, sit between about 1 in 10 billion and 1 in 50 billion, and the most optimistic estimate Georgia Tech’s Joel Sokol has seen is about 1 in 2 billion.

So a well-informed bracket faces odds in the billions to hundreds of billions. No one has ever filled out a verified perfect bracket. The longest verified perfect start is 49 games, in 2019.

Why the published odds disagree by billions

Every perfect-bracket figure is a model, not a measurement. Each one multiplies 63 game-by-game chances together, so a small change in how likely you think each game is becomes a giant change at the end. Here is the ladder, from longest odds to shortest, with the method behind each rung.

  • Coin flip, 1 in 9.2 quintillion. Every game is 50/50. Nobody believes that about a No. 1 seed against a No. 16 seed, but it is the exact answer for pure guessing.
  • Typical fan, 1 in 120.2 billion. This is NCAA.com’s figure. NCAA.com took the average Bracket Challenge player’s pick accuracy on first-round games over five years, weighted by how often each seed gap occurs, and got 66.7%. It then applied that rate to all 63 games: 0.667 raised to the 63rd power. That is crude: it uses first-round accuracy for every round, and it gives the same 66.7% to a 1-vs-16 mismatch and to a toss-up title game.
  • Always pick the higher seed, about 1 in 73.1 billion. This is our calculation, and picking every favorite like this is called chalk. It uses each seed matchup’s historical win rate: the NCAA’s 1985 to 2025 first-round records, Wizard of Odds’ seed-pair rates for the next three rounds, and 50% for each Final Four game and the title game. Wizard of Odds’ own versions come out at 1 in 56.7 billion on raw historical rates and 1 in 13.6 billion with smoothed seed strengths.
  • Market-based optimal bracket, about 1 in 50 billion. The analytics site inpredictable built team rankings from betting markets and found the single most likely bracket for each tournament from 2010 to 2013. Those odds ranged from 1 in 39 billion to 1 in 72 billion, about 1 in 50 billion. In the same years, picking strictly by seed was about 10 times worse, at 1 in 190 billion to 1 in 649 billion.
  • Best statistical models, 1 in 10 billion to 1 in 40 billion. Sokol’s benchmark is a model that predicts regular-season games correctly about 75% of the time, and he puts the best models’ perfect-bracket odds in this range. That does not mean 0.75 to the 63rd power, which would be about 1 in 74.3 million. Tournament games are harder to call than that regular-season 75% suggests, so his range is far longer.
  • Most optimistic, about 1 in 2 billion. This is the best figure Sokol has seen, and its method was not given. Even at those odds, he notes, you would need roughly 1 billion tournaments for a 50-50 chance of ever seeing a perfect bracket.

Why do two seed-based figures differ so much (about 1 in 73.1 billion here, 1 in 190 billion or worse at inpredictable)? They measure different things. Ours uses long-run averages for a generic tournament. inpredictable priced the seed bracket in four specific years using that year’s betting markets, which could rate a team well above or below its seed.

Older estimates fill in the history. In 2014, Carl Bialik of FiveThirtyEight showed that a flat 70% accuracy on every game gives 1 in 5.7 billion, while noting that real accuracy varies from game to game. His 2006 Wall Street Journal column, using Ken Pomeroy’s ratings, put the chance of a perfect bracket at about 1 in 722 billion.

One more figure circulates and does not belong on the ladder. Betting moneylines priced the brackets that actually happened from 2010 to 2013 at 1 in 571 trillion to 1 in 20,034 trillion. Those are the odds of the real results, upsets included, which no sensible person would have picked in advance. A perfect-bracket figure asks about the best bracket you could pick, not the one that happened.

Where perfect brackets die

Odds an all-chalk men's bracket is still perfect, by round (1 in N, log scale, historical seed rates). Perfect after Round of 64 (32 games): 36,500 1 in N (log scale); After Round of 32 (48 games); 2025 and 2026 streaks ended here: 30,000,000 1 in N (log scale); After Sweet 16 (56 games); record 49-game streak ended at game 50: 760,000,000 1 in N (log scale); Full bracket (63 games): 73,100,000,000 1 in N (log scale) (highlighted) (log scale). Mathematical model; assumptions: Games are independent. In reality upsets cluster and brackets are correlated (many entrants pick the same favorites), so expected counts and costs here are upper bounds on the chance that anyone is perfect.BOOK OF ODDSOdds an all-chalk men's bracket is still perfect,by round (1 in N, log scale, historical seed rates)Perfect after Round of 64 (32games)36,500 1 in N (log scale)After Round of 32 (48games); 2025 and 2026streaks ended here30,000,000 1 in N (log scale)After Sweet 16 (56 games);record 49-game streak endedat game 50760,000,000 1 in N (log scale)▶ Full bracket (63 games)73,100,000,000 1 in N (log scale)Log scale (bars do not start at zero): 10,000 to 100,000,000,000 1 in N (log scale), each gridline×10 · ▶ = highlightedMathematical model · Games are independent. In reality upsets cluster and brackets are correlated(many entrants pick the same favorites), so expected counts and costs here are upper bounds onthe chance that anyone is perfect.
Odds an all-chalk men's bracket is still perfect, by round (1 in N, log scale, historical seed rates). Perfect after Round of 64 (32 games): 36,500 1 in N (log scale); After Round of 32 (48 games); 2025 and 2026 streaks ended here: 30,000,000 1 in N (log scale); After Sweet 16 (56 games); record 49-game streak ended at game 50: 760,000,000 1 in N (log scale); Full bracket (63 games): 73,100,000,000 1 in N (log scale) (highlighted) (log scale). Mathematical model; assumptions: Games are independent. In reality upsets cluster and brackets are correlated (many entrants pick the same favorites), so expected counts and costs here are upper bounds on the chance that anyone is perfect.BOOK OF ODDSOdds an all-chalk men'sbracket is still perfect, byround (1 in N, log scale,historical seed rates)Perfect after Round of 64 (32 games)36,500 1 in N (log scale)After Round of 32 (48 games); 2025 and 2026streaks ended here30,000,000 1 in N (log scale)After Sweet 16 (56 games); record 49-gamestreak ended at game 50760,000,000 1 in N (log scale)▶ Full bracket (63 games)73,100,000,000 1 in N (log scale)Log scale (bars do not start at zero): 10,000 to100,000,000,000 1 in N (log scale), each gridline×10 · ▶ = highlightedMathematical model · Games are independent. Inreality upsets cluster and brackets are correlated(many entrants pick the same favorites), so expectedcounts and costs here are upper bounds on thechance that anyone is perfect.
Mathematical model · Games are independent. In reality upsets cluster and brackets are correlated (many entrants pick the same favorites), so expected counts and costs here are upper bounds on the chance that anyone is perfect.
View the data table
Outcome
Perfect after Round of 64 (32 games)36,500
After Round of 32 (48 games); 2025 and 2026 streaks ended here30,000,000
After Sweet 16 (56 games); record 49-game streak ended at game 50760,000,000
Full bracket (63 games)73,100,000,000

Run a chalk bracket through our calculation and watch it shrink. A perfect first round, all 32 games, is about 1 in 36,500. Getting the second round right as well, given a perfect first round, is about 1 in 821, so a bracket perfect through 48 games is about 1 in 30.0 million. Through the Sweet 16 it is about 1 in 760 million, and the full 63 games come to about 1 in 73.1 billion.

In log terms the first two rounds do most of the damage, because they hold 48 of the 63 games, but the last 15 games still lengthen the odds from about 1 in 30.0 million to about 1 in 73.1 billion.

In 2026, the one year this page counts, real brackets collapsed in the same early rounds. In 2026, NCAA.com tracked about 36 million brackets across the major online games. After the first round, about 224 were still perfect. The last one, an ESPN entry called ‘christienter,’ lasted 43 games and busted in game 44, when No. 6 Tennessee beat No. 3 Virginia in the second round. In 2025 the last perfect bracket fell in game 43. The record run, 49 games, made it one game into the Sweet 16.

The first-round seed record, updated

A No. 1 seed against a No. 16 seed is the closest thing to a sure pick, and it is no longer perfect. From 1985 through 2025, No. 1 seeds went 158-2 (99%) in that game. The two losses: UMBC over Virginia in 2018 and Fairleigh Dickinson over Purdue in 2023. After the 2026 tournament the record stands at 162-2.

The other higher seeds, 1985 to 2025: No. 2 seeds 149-11 (93%), No. 3 seeds 137-23 (86%), No. 4 seeds 127-33 (79%), No. 5 seeds 103-57 (64%), No. 6 seeds 98-62 (61%) and No. 7 seeds 97-62 (61%). The 8-vs-9 game is the odd one out: No. 8 seeds are 77-83 (48%), so the higher seed is actually the underdog.

Multiply those rates across four regions and a chalk first round comes to about 1 in 36,500. Pick the 9 seeds instead of the 8 seeds and it improves to about 1 in 27,000. An earlier version of this page made a chalk first round look much easier because it used seed records from before 2018, when No. 1 seeds had never lost and several other seeds had better records than they do now.

Upsets are not rare accidents. The NCAA counts an average of 8.3 upsets per tournament since 1985, where an upset means the winner was seeded at least five lines worse. On average, 4.6 come in the first round and 3 in the second. A chalk bracket is counting on none of a year’s upsets (8.3 on average) showing up.

Has anyone ever come close?

The closest verified bracket belongs to Gregg Nigl of Columbus, Ohio, in 2019. He got the first 49 games right: both opening rounds plus the first game of the Sweet 16. His bracket busted in game 50, when Purdue beat Tennessee.

Recent years have ended sooner, in the second round. In 2025 the last perfect bracket died in game 43, when No. 3 Kentucky beat No. 6 Illinois. The higher seed won that one, so the last survivor fell on the upset it had picked. In 2026 the end came in game 44, No. 6 Tennessee over No. 3 Virginia.

No verified perfect men’s bracket has ever been recorded.

Tens of millions of brackets, still no winner

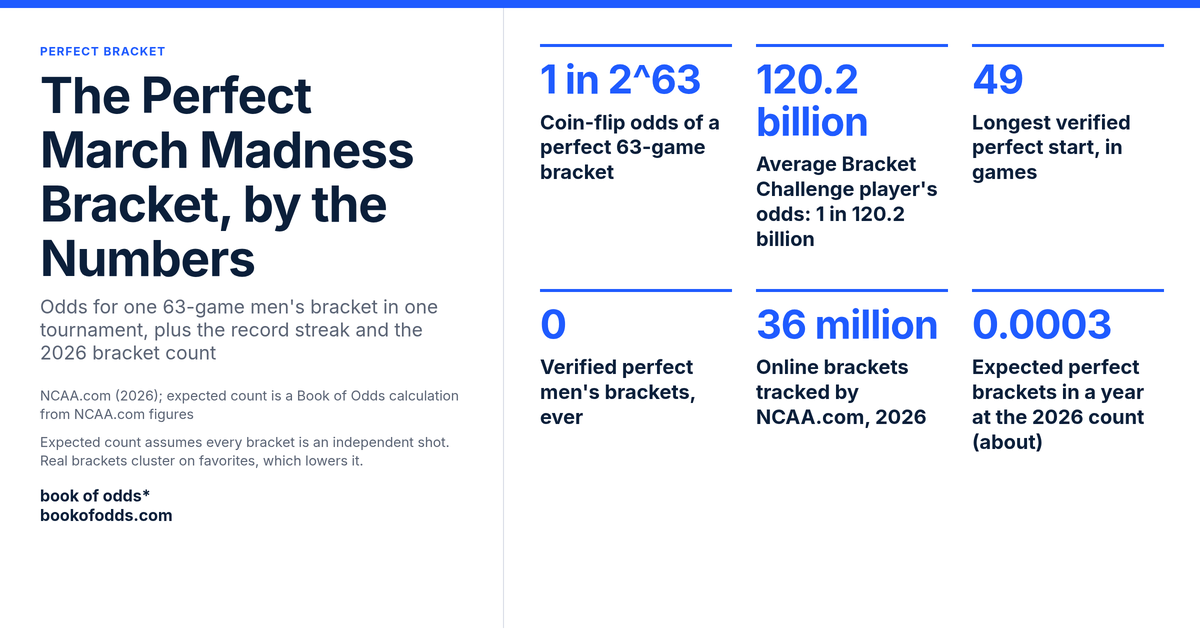
Stats card: perfect-bracket odds 1 in 2^63 by coin flip and 1 in 120.2 billion for the average Bracket Challenge player; record 49 games (2019); 0 verified perfect brackets; 36 million tracked in 2026; about 0.0003 expected a year.
NCAA.com (2026); expected count is a Book of Odds calculation from NCAA.com figures

Lots of brackets get filled out. NCAA.com tracked about 36 million men’s brackets across the major online games in 2026 (it normally tracks about 20 to 25 million a year). That count is probably a floor, in our reading, because it leaves out paper sheets and office pools. Survey estimates from the American Gaming Association run higher: 56.3 million American adults planning to enter a bracket contest in 2023, and, in 2015, 40 million Americans filling out more than 70 million brackets.

Now multiply. The expected count is the average number of perfect brackets you would see per year over a very long run: the number of brackets times the chance that each one is perfect. With the 36 million brackets NCAA.com tracked in 2026 at 1 in 120.2 billion, it is about 0.0003 a year, or one perfect bracket about every 3,300 years. NCAA.com says it normally tracks about 20 to 25 million online brackets a year, which at the same odds would be about 4,800 to 6,000 years.

Better pickers barely rescue it. At Bialik’s illustrative 1 in 5.7 billion, the expected count on the 2026 count of 36 million brackets is about 0.006 a year, or one about every 160 years. At Sokol’s most optimistic 1 in 2 billion, it is at most about 0.018 a year on that same count. At coin-flip odds, it is about 4 in a trillion.

Those figures are generous, because they treat every bracket as an independent shot. Brackets are not independent. NCAA.com says typically about 94% of the entries in its Bracket Challenge Game are unique, but unique is not the same as different. Two brackets that differ only in one 8-vs-9 pick both die on the same early upset. Millions of entries crowd around the same favorites, which pushes the chance that even one survives below the simple multiplication.

Warren Buffett’s billion-dollar bracket and other prize challenges

Billion-dollar bracket prizes and their expected cost to the sponsor (Quicken 2014, Kalshi 2026, Berkshire employees). Quicken/Buffett 2014: grand prize, face value: 1,000,000,000 US dollars; Quicken/Buffett 2014: lump-sum option: 500,000,000 US dollars; Quicken 2014: expected cost, 15 million entries at 1 in 120.2 billion: 125,000 US dollars (highlighted); Quicken 2014: inpredictable fair value (10M entries, 1 in 50 billion): 200,000 US dollars; Kalshi 2026: grand prize (ten $100 million installments): 1,000,000,000 US dollars; Kalshi 2026: expected cost, 10M entries at 1 in 120.2 billion: 83,000 US dollars; Kalshi 2026: expected cost at inpredictable's 1 in 50 billion: 200,000 US dollars; Kalshi 2026: expected cost at Wizard's smoothed 1 in 13.6 billion: 735,000 US dollars; Kalshi 2026: best-bracket prize if nobody was perfect: 1,000,000 US dollars; Berkshire employees: yearly prize for life, perfect through Sweet 16: 1,000,000 US dollars; Berkshire employees 2025: prize for 30 of 32 first-round picks: 1,000,000 US dollars. Per event, 2014 men's tournament contest entrants. Source: NPR, data year 2014.BOOK OF ODDSBillion-dollar bracket prizes and their expectedcost to the sponsor (Quicken 2014, Kalshi 2026,Berkshire employees)per event · 2014 men's tournament contest entrantsQuicken/Buffett 2014: grand prize, face value1,000,000,000 US dollarsQuicken/Buffett 2014: lump-sum option500,000,000 US dollars▶ Quicken 2014: expected cost, 15 million entries at 1 in 120.2billion125,000 US dollarsQuicken 2014: inpredictable fair value (10M entries, 1 in 50 billion)200,000 US dollarsKalshi 2026: grand prize (ten $100 million installments)1,000,000,000 US dollarsKalshi 2026: expected cost, 10M entries at 1 in 120.2 billion83,000 US dollarsKalshi 2026: expected cost at inpredictable's 1 in 50 billion200,000 US dollarsKalshi 2026: expected cost at Wizard's smoothed 1 in 13.6 billion735,000 US dollarsKalshi 2026: best-bracket prize if nobody was perfect1,000,000 US dollarsBerkshire employees: yearly prize for life, perfect through Sweet 161,000,000 US dollarsBerkshire employees 2025: prize for 30 of 32 first-round picks1,000,000 US dollarsSource: NPR · Data year 2014
Billion-dollar bracket prizes and their expected cost to the sponsor (Quicken 2014, Kalshi 2026, Berkshire employees). Quicken/Buffett 2014: grand prize, face value: 1,000,000,000 US dollars; Quicken/Buffett 2014: lump-sum option: 500,000,000 US dollars; Quicken 2014: expected cost, 15 million entries at 1 in 120.2 billion: 125,000 US dollars (highlighted); Quicken 2014: inpredictable fair value (10M entries, 1 in 50 billion): 200,000 US dollars; Kalshi 2026: grand prize (ten $100 million installments): 1,000,000,000 US dollars; Kalshi 2026: expected cost, 10M entries at 1 in 120.2 billion: 83,000 US dollars; Kalshi 2026: expected cost at inpredictable's 1 in 50 billion: 200,000 US dollars; Kalshi 2026: expected cost at Wizard's smoothed 1 in 13.6 billion: 735,000 US dollars; Kalshi 2026: best-bracket prize if nobody was perfect: 1,000,000 US dollars; Berkshire employees: yearly prize for life, perfect through Sweet 16: 1,000,000 US dollars; Berkshire employees 2025: prize for 30 of 32 first-round picks: 1,000,000 US dollars. Per event, 2014 men's tournament contest entrants. Source: NPR, data year 2014.BOOK OF ODDSBillion-dollar bracket prizesand their expected cost tothe sponsor (Quicken 2014,Kalshi 2026, Berkshireemployees)per event · 2014 men's tournament contestentrantsQuicken/Buffett2014: grand prize,face value1,000,000,000 US dollarsQuicken/Buffett2014: lump-sumoption500,000,000 US dollars▶ Quicken 2014:expected cost, 15million entries at 1in 120.2 billion125,000 US dollarsQuicken 2014:inpredictable fairvalue (10M entries, 1in 50 billion)200,000 US dollarsKalshi 2026: grandprize (ten $100million installments)1,000,000,000 US dollarsKalshi 2026:expected cost, 10Mentries at 1 in 120.2billion83,000 US dollarsKalshi 2026:expected cost atinpredictable's 1 in50 billion200,000 US dollarsKalshi 2026:expected cost atWizard's smoothed 1in 13.6 billion735,000 US dollarsKalshi 2026:best-bracket prize ifnobody was perfect1,000,000 US dollarsBerkshireemployees: yearlyprize for life, perfectthrough Sweet 161,000,000 US dollarsBerkshire employees2025: prize for 30 of32 first-round picks1,000,000 US dollarsSource: NPR · Data year 2014
NPR · Data year 2014
View the data table
Outcome
Quicken/Buffett 2014: grand prize, face value1,000,000,000
Quicken/Buffett 2014: lump-sum option500,000,000
Quicken 2014: expected cost, 15 million entries at 1 in 120.2 billion125,000
Quicken 2014: inpredictable fair value (10M entries, 1 in 50 billion)200,000
Kalshi 2026: grand prize (ten $100 million installments)1,000,000,000
Kalshi 2026: expected cost, 10M entries at 1 in 120.2 billion83,000
Kalshi 2026: expected cost at inpredictable's 1 in 50 billion200,000
Kalshi 2026: expected cost at Wizard's smoothed 1 in 13.6 billion735,000
Kalshi 2026: best-bracket prize if nobody was perfect1,000,000
Berkshire employees: yearly prize for life, perfect through Sweet 161,000,000
Berkshire employees 2025: prize for 30 of 32 first-round picks1,000,000

If you came here to ask whether a billion-dollar bracket prize is real: yes, and it is also cheap to offer. The tool is expected cost, the sponsor’s long-run average payout if the same contest ran over and over. It equals the number of entries times the chance each one is perfect times the prize.

Quicken Loans, 2014. Quicken Loans and Yahoo Sports ran the Billion Dollar Bracket Challenge, insured by Warren Buffett’s Berkshire Hathaway. A perfect 63-game bracket would have paid $1 billion in 40 annual installments of $25 million, or a $500 million lump sum. Entry was capped at the first 15 million qualified entrants, one per person, U.S. residents 18 and older. The 20 best imperfect brackets would get $100,000 each.

It ended fast. Every entry was eliminated during the Round of 64; the last three perfect brackets fell when No. 8 Memphis beat No. 9 George Washington. Quicken never said how many people entered.

Even with all 15 million slots filled at the typical fan’s 1 in 120.2 billion, the chance of any winner was about 0.012%. Slate, using DePaul professor Jeff Bergen’s 1 in 128 billion for informed pickers and an assumed 15 million entries, got about 0.012% (1 in 8,500). That makes the expected payout about $125,000 at the $1 billion face value, or about $62,000 at the lump sum. inpredictable put the fair value of Berkshire’s insurance at about $200,000 (the original 10 million entry cap at 1 in 50 billion), called that a floor, and guessed the real premium was at least seven figures.

Buffett reportedly priced the risk by the head. In an earlier version of the deal with Yahoo, which fell through, he reportedly wanted an extra premium for every entrant beyond 10 million. We found no repeat of the public contest.

Kalshi, 2026. The prediction market Kalshi offered a free $1 Billion Perfect Bracket Challenge, one entry per person, capped at 10 million entries (Kalshi could raise the cap). Kalshi could choose to pay the prize as ten annual installments of $100 million, with $1 million for the best bracket if no one was perfect. You needed an identity-verified Kalshi account, and residents of Florida and New York could not enter.

Every perfect Kalshi entry was gone in the Round of 32, when No. 9 Iowa, about a 16% underdog in the betting market, beat No. 1 Florida. The $1 million best-bracket prize went to a user named Jackie, who had UCLA as champion. With a full 10 million entries, the expected cost was about $83,000 at the typical fan’s odds, about $200,000 at inpredictable’s 1 in 50 billion, and about $735,000 at Wizard of Odds’ smoothed chalk figure of 1 in 13.6 billion. Each is an upper bound: duplicate brackets, shared prizes and the installment option would all lower it.

Berkshire’s employee contest. Since 2016, Buffett has run a contest for Berkshire Hathaway employees (about 377,000 of them in 2018). Picking every game through the Sweet 16, meaning all 16 teams that reach it, paid $1 million a year for life, with $100,000 for the best bracket. In 2024, employees could skip the eight games involving No. 1 and No. 2 seeds. According to CNBC, anyone who picked the winners of at least 30 of the 32 first-round games was eligible for the $1 million.

That finally produced a winner. A FlightSafety International employee went 31 for 32 and took the $1 million, and 11 others who also went 31 for 32 got $100,000 each. The winner’s only miss in the first 45 games was Illinois beating Xavier: a superb bracket, and still not perfect.

So what is your entry worth? Its slice of an $83,000 or $125,000 expected payout, split across millions of entries, which is next to nothing. A free entry is harmless fun, and the prize you could realistically win is the consolation money for the best imperfect bracket. Sponsors still buy insurance because of tail risk, the small chance of a huge loss: the expected cost is tiny, but one perfect bracket would cost $1 billion. Insurers take that risk for a fee, and If inpredictable’s guess of a seven-figure premium against a $200,000 fair value is right, the margin was comfortable.

Putting the odds in perspective

One Powerball ticket has a 1 in 292,201,338 chance of hitting the jackpot in a draw, about 1 in 292 million. A typical fan’s perfect bracket is 1 in 120.2 billion, and an all-chalk bracket about 1 in 73.1 billion. Even Sokol’s most optimistic 1 in 2 billion is longer odds than the jackpot.

The comparison has limits. Powerball’s figure is exact arithmetic for a fair draw, while the bracket figures are models built on assumptions about basketball. A ticket covers one draw; a bracket covers a whole tournament. For the lottery side of the comparison, see our look at the strategies Powerball players use.

Perfect bracket vs. winning your pool

These are two different goals, and they call for different brackets.

If you are chasing perfection, pick the most likely winner of every game. That means mostly chalk, which our calculation puts at about 1 in 73.1 billion, with one exception the record leans toward: take the 9 seeds in the 8-vs-9 games. The 9 seeds lead 83-77 from 1985 through 2025, and picking them improves a perfect first round from about 1 in 36,500 to about 1 in 27,000. Rankings based on betting markets did better than seed picks in inpredictable’s test years, about 1 in 50 billion.

If you are trying to win your office pool, perfection is not the target. You only need to beat the other brackets in your pool, and, in our reading, most of them lean on the same favorites. With an average of 8.3 upsets per tournament, a bracket with a few well-chosen upsets could pull away from the crowd if those upsets land. That is our reasoning, not a sourced finding. How many to pick depends on your pool’s size and scoring, and we have no data source for that, so we won’t invent a number.

What not to do, either way:

  • Don’t pick a No. 16 seed to beat a No. 1. It has happened twice in 164 games.
  • Don’t treat a free billion-dollar contest as a retirement plan. With every entry at the typical fan’s odds, Kalshi’s whole expected payout across 10 million entries was about $83,000.

✱ The Outlier

Be the interesting one at dinner.

One email. A few surprising odds. Plenty to talk about.

Email signup opens soon.

What these numbers assume

  • Games are independent. Every model here multiplies per-game chances as if one game tells you nothing about another. In reality a team’s strength shapes every game it plays, so results are linked. No source we found measures how much that changes the odds, so treat it as an open question, not a correction.
  • History stands in for this year. Seed rates are long-run averages: first-round records through 2025, and later-round rates from Wizard of Odds’ historical data, which runs to about 2021. A given year’s field can be stronger or weaker at the top.
  • The typical fan figure is a flat rate. NCAA.com’s 1 in 120.2 billion applies a flat 66.7% per game, the average Bracket Challenge player’s first-round accuracy, to all 63 games. A real fan is far better than 66.7% on a 1-vs-16 game and worse on a coin-flip matchup.
  • The First Four is left out. Most bracket contests start at the Round of 64. Include the four First Four games and a coin-flip bracket becomes 1 in 2^67, about 1 in 147.6 quintillion.
  • Expected counts and costs are ceilings. They assume every bracket is an independent, distinct shot and that every contest slot was filled. Quicken never disclosed its entrant count.
  • Older figures are retired. An earlier version of this page used seed records from before 2018, when No. 1 seeds were unbeaten against No. 16 seeds. Every chalk figure on this page uses records updated through 2025.

Correction, October 18, 2026: We had said we had not seen how NCAA.com derived its 1 in 120.2 billion figure, and offered our own reconstruction. NCAA.com published its method, and the page now explains it. We also tied the 36 million bracket count to 2026, the year NCAA.com counted them.
Outcome
Coin flip on every game (exact math)9,223,372,036,854,775,808
Average Bracket Challenge player (NCAA.com figure)120,200,000,000
Always pick higher seed (Book of Odds calculation)73,100,000,000
Higher seed, raw historical rates (Wizard of Odds)56,700,000,000
Market-based optimal bracket, 2010 to 2013 (inpredictable)50,000,000,000
Higher seed, smoothed seed strengths (Wizard of Odds)13,600,000,000
Most optimistic estimate seen (Sokol)2,000,000,000
What changed
  • Bracket counts: the old page said Americans fill out 40 million brackets every year. The American Gaming Association estimated 40 million Americans filling out more than 70 million brackets in 2015 and 56.3 million adults entering contests in 2023, and NCAA.com tracked about 36 million online brackets in 2026, so the old figure confused people with brackets and is out of date. No. 1 vs. No. 16: the old page said No. 1 seeds had won 100% of these games. That was true before 2018, but UMBC (2018) and Fairleigh Dickinson (2023) have since won, and No. 1 seeds are 162-2 after 2026. No. 2 to No. 4 seeds: the old page gave 96%, 85% and 78%. Records through 2025 are 149-11 (93%), 137-23 (86%) and 127-33 (79%), reflecting more years of upsets. No. 5 to No. 7 seeds: the old page gave 69%, 69% and 61%. Through 2025 they are 103-57 (64%), 98-62 (61%) and 97-62 (61%), because 12, 11 and 10 seeds have kept winning. 8 vs. 9: the old page called it an even split. Through 2025, No. 8 seeds are 77-83 (48%), so the 9 seed is the slightly better pick. Chalk first round: the old page gave 1 in 13,040. With 1985 to 2025 rates it is about 1 in 36,500 (about 1 in 27,000 picking the 9 seeds), because the updated seed rates are lower. Second round: the old page gave about 1 in 1,032 for a perfect chalk second round. Using historical rates for the specific chalk matchups, it is about 1 in 821 given a perfect first round. Two rounds: the old page gave 1 in 13,460,000. With the updated rates it is about 1 in 30.0 million. Full chalk bracket: the old page gave 1 in 35,360,000,000. With seed records through 2025, including two 16-over-1 upsets, it is about 1 in 73.1 billion by our calculation (Wizard of Odds: 1 in 56.7 billion on raw rates, 1 in 13.6 billion smoothed), because the old figure assumed No. 1 seeds never lose in the first round.

Sources

  1. The absurd odds of a perfect NCAA bracketNCAA.com · Data year 2026 · Accessed 2026-09-30 · Primary source
  2. How hard is it to pick a perfect bracket?NCAA.com (quoting DePaul University professor Jeffrey Bergen) · Data year 2026 · Accessed 2026-09-30 · Primary source
  3. What are the odds of getting a perfect bracket?WHTM abc27 · Data year 2026 · Accessed 2026-09-30
  4. Buffett's Billion Won't Lead to a Perfect BracketFiveThirtyEight · Data year 2014 · Accessed 2026-09-30
  5. The $1 Billion Bracket – Part Oneinpredictable (sports analytics blog) · Data year 2006 · Accessed 2026-09-30
  6. Records for every seed in March Madness from 1985 to 2025NCAA.com · Data year 2025 · Accessed 2026-09-30 · Primary source
  7. How often do upsets happen in the first round of the NCAA Tournament?NBC Philadelphia · Data year 2025 · Accessed 2026-09-30
  8. History of 1 seed vs. 16 seed in March MadnessNCAA.com · Data year 2026 · Accessed 2026-09-30 · Primary source
  9. Bracketology: NCAA Tournament Odds by SeedBetFirm · Data year 2025 · Accessed 2026-09-30
  10. The longest an NCAA bracket has ever stayed perfectNCAA.com · Data year 2019 · Accessed 2026-09-30 · Primary source
  11. What is the longest a March Madness bracket has stayed perfect?WHTM abc27 · Data year 2019 · Accessed 2026-09-30
  12. Has there ever been a perfect March Madness bracket?Yahoo Sports · Data year 2019 · Accessed 2026-09-30
  13. Final men's perfect bracket busts with Tennessee's 79-72 win over VirginiaNCAA.com · Data year 2026 · Accessed 2026-09-30 · Primary source
  14. The last perfect bracket in the men's NCAA Tournament has fallenKXAN · Data year 2026 · Accessed 2026-09-30
  15. Has there ever been a perfect March Madness bracket?NBC Connecticut · Data year 2026 · Accessed 2026-09-30
  16. Kalshi $1 Billion Perfect Bracket Challenge Returns for March Madness 2026Fox Sports · Data year 2026 · Accessed 2026-09-30
  17. 68 million Americans to bet on March MadnessIntergame (reporting AGA survey) · Data year 2026 · Accessed 2026-09-30
  18. Estimated 40 million fill out bracketsABC7 News (reporting AGA) · Data year 2026 · Accessed 2026-09-30
  19. Americans To Bet $2 Billion on 70 Million March Madness Brackets This YearAmerican Gaming Association · Data year 2026 · Accessed 2026-09-30
  20. Are There Any Perfect March Madness Brackets Left?Covers · Data year 2026 · Accessed 2026-09-30
  21. Quicken Loans Partners With Yahoo Sports To Launch Its 'Billion Dollar Bracket Challenge'Rocket Companies (Quicken Loans) · Data year 2014 · Accessed 2026-09-30
  22. Why You Won't Win Warren Buffett's Billion-Dollar BracketNPR · Data year 2014 · Accessed 2026-09-30
  23. After upsets, anyone still in Buffett's bracket challenge?CBS News (AP) · Data year 2014 · Accessed 2026-09-30
  24. Don't Take Warren Buffett's Bracket ChallengeSlate · Data year 2014 · Accessed 2026-09-30
  25. Buffett vs. YahooSlate · Data year 2014 · Accessed 2026-09-30
  26. Warren Buffett promises lifetime payout for perfect weekend bracketESPN · Data year 2014 · Accessed 2026-09-30
  27. Berkshire Hathaway employee wins $1 million in Warren Buffett's March Madness bracket challengeCNBC · Data year 2025 · Accessed 2026-09-30
  28. Warren Buffett is making it easier for his employees to win $1 million in Berkshire Hathaway's March Madness poolFortune · Data year 2025 · Accessed 2026-09-30
  29. Warren Buffett's 2018 March Madness Bracket Contest: $1 Million A Year For LifeForbes · Data year 2025 · Accessed 2026-09-30
  30. Warren Buffett's March Madness Offer: $1M A Year For Life For Perfect BracketCBS Los Angeles · Data year 2025 · Accessed 2026-09-30
  31. Warren Buffett to employees: Pick Sweet 16, win $1 million a year for lifeThe Washington Post · Data year 2025 · Accessed 2026-09-30
  32. Warren Buffett can finally give away his $1 million March Madness prizeFortune · Data year 2025 · Accessed 2026-09-30
  33. Here's how to pick March Madness men's upsets, according to the dataNCAA.com · Data year 2025 · Accessed 2026-09-30 · Primary source
  34. The longest an NCAA bracket has ever stayed perfectNCAA.com · Data year 2025 · Accessed 2026-09-30 · Primary source
  35. Official Rules: $1 Billion 2026 Perfect Bracket Men's College Basketball ContestKalshi · Data year 2026 · Accessed 2026-09-30
  36. Kalshi's Bonkers Billion-Dollar Bracket ChallengePokerNews · Data year 2026 · Accessed 2026-09-30
  37. Probability of a Perfect BracketWizard of Odds · Data year 2021 · Accessed 2026-09-30
  38. The $1 Billion Bracket – Part Twoinpredictable · Data year 2013 · Accessed 2026-09-30
  39. PowerballVirginia Lottery · Data year 2026 · Accessed 2026-09-30
  40. Powerball winner in Ohio hits prize worth $150,000WKYC · Data year 2026 · Accessed 2026-09-30
  41. The Numbers Guy: Picking the Perfect NCAA BracketCarl Bialik, Wall Street Journal, March 23, 2006 · Data year 2006 · Accessed 2026-10-18 · Primary source
Odds that one 63-game men's bracket is perfect in a tournament, by method, as 1 in N on a log scale. Coin flip on every game (exact math): 1 in 9,223,372,036,854,775,808. Average Bracket Challenge player (NCAA.com figure, highlighted): 1 in 120,200,000,000. Always pick higher seed (Book of Odds calculation): 1 in 73,100,000,000. Higher seed, raw historical rates (Wizard of Odds): 1 in 56,700,000,000. Market-based optimal bracket, 2010 to 2013 (inpredictable): 1 in 50,000,000,000. Best models, long end of range (Sokol): 1 in 40,000,000,000. Higher seed, smoothed seed strengths (Wizard of Odds): 1 in 13,600,000,000. Best models, short end of range (Sokol): 1 in 10,000,000,000. Most optimistic estimate seen (Sokol): 1 in 2,000,000,000. Mathematical model; assumptions: a flat, independent per-game accuracy of about 66.7% across all 63 games. NCAA.com derived 66.7% from the average Bracket Challenge player's first-round accuracy and applied it to all 63 games; 0.667^63 reproduces 120.2 billion.
Share this card · Download the image

How we calculated

Coin flip: 2 multiplied by itself 63 times (2^63) gives 9,223,372,036,854,775,808 equally likely brackets, so one bracket's chance is 1 in that number, about 1 in 9.2 quintillion. Including the First Four makes it 2^67, or 1 in 147,573,952,589,676,412,928 (about 1 in 147.6 quintillion). Average Bracket Challenge player: 1 in 120.2 billion is NCAA.com's figure. NCAA.com published its method: 66.7% is the average Bracket Challenge player's first-round accuracy, applied to all 63 games. A flat 0.667 raised to the 63rd power gives 1 in 120,246,505,256, which matches; exactly two-thirds would give 1 in 124,093,581,920 (about 1 in 124.1 billion). Chalk: for each game we used the higher seed's historical win rate: NCAA first-round records for 1985 to 2025 (for example 158 wins in 160 games for No. 1 seeds; the 8 seed in 8 vs 9), Wizard of Odds' seed-pair rates for rounds two through four (1 vs 8 .800, 4 vs 5 .560, 3 vs 6 .600, 2 vs 7 .695, 1 vs 4 .734, 2 vs 3 .607, 1 vs 2 .537), and 50% for each Final Four game and the title. Each matchup rate is applied once per region and all are multiplied at full precision, assuming games are independent. Survival odds given a perfect previous round: Round of 64 1 in 36,490; Round of 32 1 in 821; Sweet 16 1 in 25.378; Elite Eight 1 in 12.025; Final Four 1 in 4; title 1 in 2. Cumulative: 1 in 36,490 (first round, shown as about 1 in 36,500), 1 in 29,958,366 through two rounds (about 1 in 30.0 million), 1 in 760,289,720 through the Sweet 16 (about 1 in 760 million) and 1 in 73,142,864,177 for the full bracket (about 1 in 73.1 billion). Picking the 9 seeds in the 8 vs 9 games instead gives 1 in 27,029 for the first round (about 1 in 27,000). A flat 75% on every game would give 1 in 74,325,939; we show it only to explain why Sokol's range is not 0.75^63. Expected perfect brackets per year = number of brackets times the per-bracket probability (36 million divided by 120.2 billion is about 0.0003, or one every 3,339 years, shown as about 3,300). Expected sponsor cost = entries times probability times prize (15 million x 1/120.2 billion x $1 billion is $124,792, shown as about $125,000, for Quicken; 10 million x 1/120.2 billion x $1 billion is $83,195, shown as about $83,000, for Kalshi). Other model figures (Wizard of Odds, inpredictable, Sokol, Bialik) are quoted as published, not reproduced. Rounding: odds are shown as 1 in N to one decimal in millions, billions or quintillions, first-round odds to the nearest hundred or thousand, dollars to the nearest thousand below $1 million, and seed win rates to whole percents from the NCAA's records.

✱ The Outlier

Be the interesting one at dinner.

One email. A few surprising odds. Plenty to talk about.

Email signup opens soon.