

How many people do you need in a room for better than even odds that two share a birthday: about 180, about 60, or 23?
It is 23, under the textbook assumptions. Assume every birthday is independent, all 365 days are equally likely and February 29 is set aside. Then a group of 23 people has about a 51% chance that at least two share a birthday. This is the birthday problem, often called the birthday paradox, though nothing in it contradicts itself. It is a surprise, not a contradiction, and a bet worth taking at a party, though only just. Try it yourself in our quiz.
Why the birthday problem’s answer is so low
Most people hear the question as “will someone share my birthday?” That is a much harder target. Under the same model, the chance that at least one of the other 22 people in a room of 23 shares your own birthday is only about 5.9%. For that personal match to pass 50%, you would need 253 other people.
The group question is looser. It asks whether any two people match, on any day of the year. Every new arrival can match anyone already in the room, not just you, so the chances of a match pile up much faster than intuition expects. The 5.9% answers a different question, about one named birthday. The group question has no favourite: a match on March 3 counts exactly as much as a match on yours. That is why the group figure for 23 people stays about 51%.
How fast it climbs
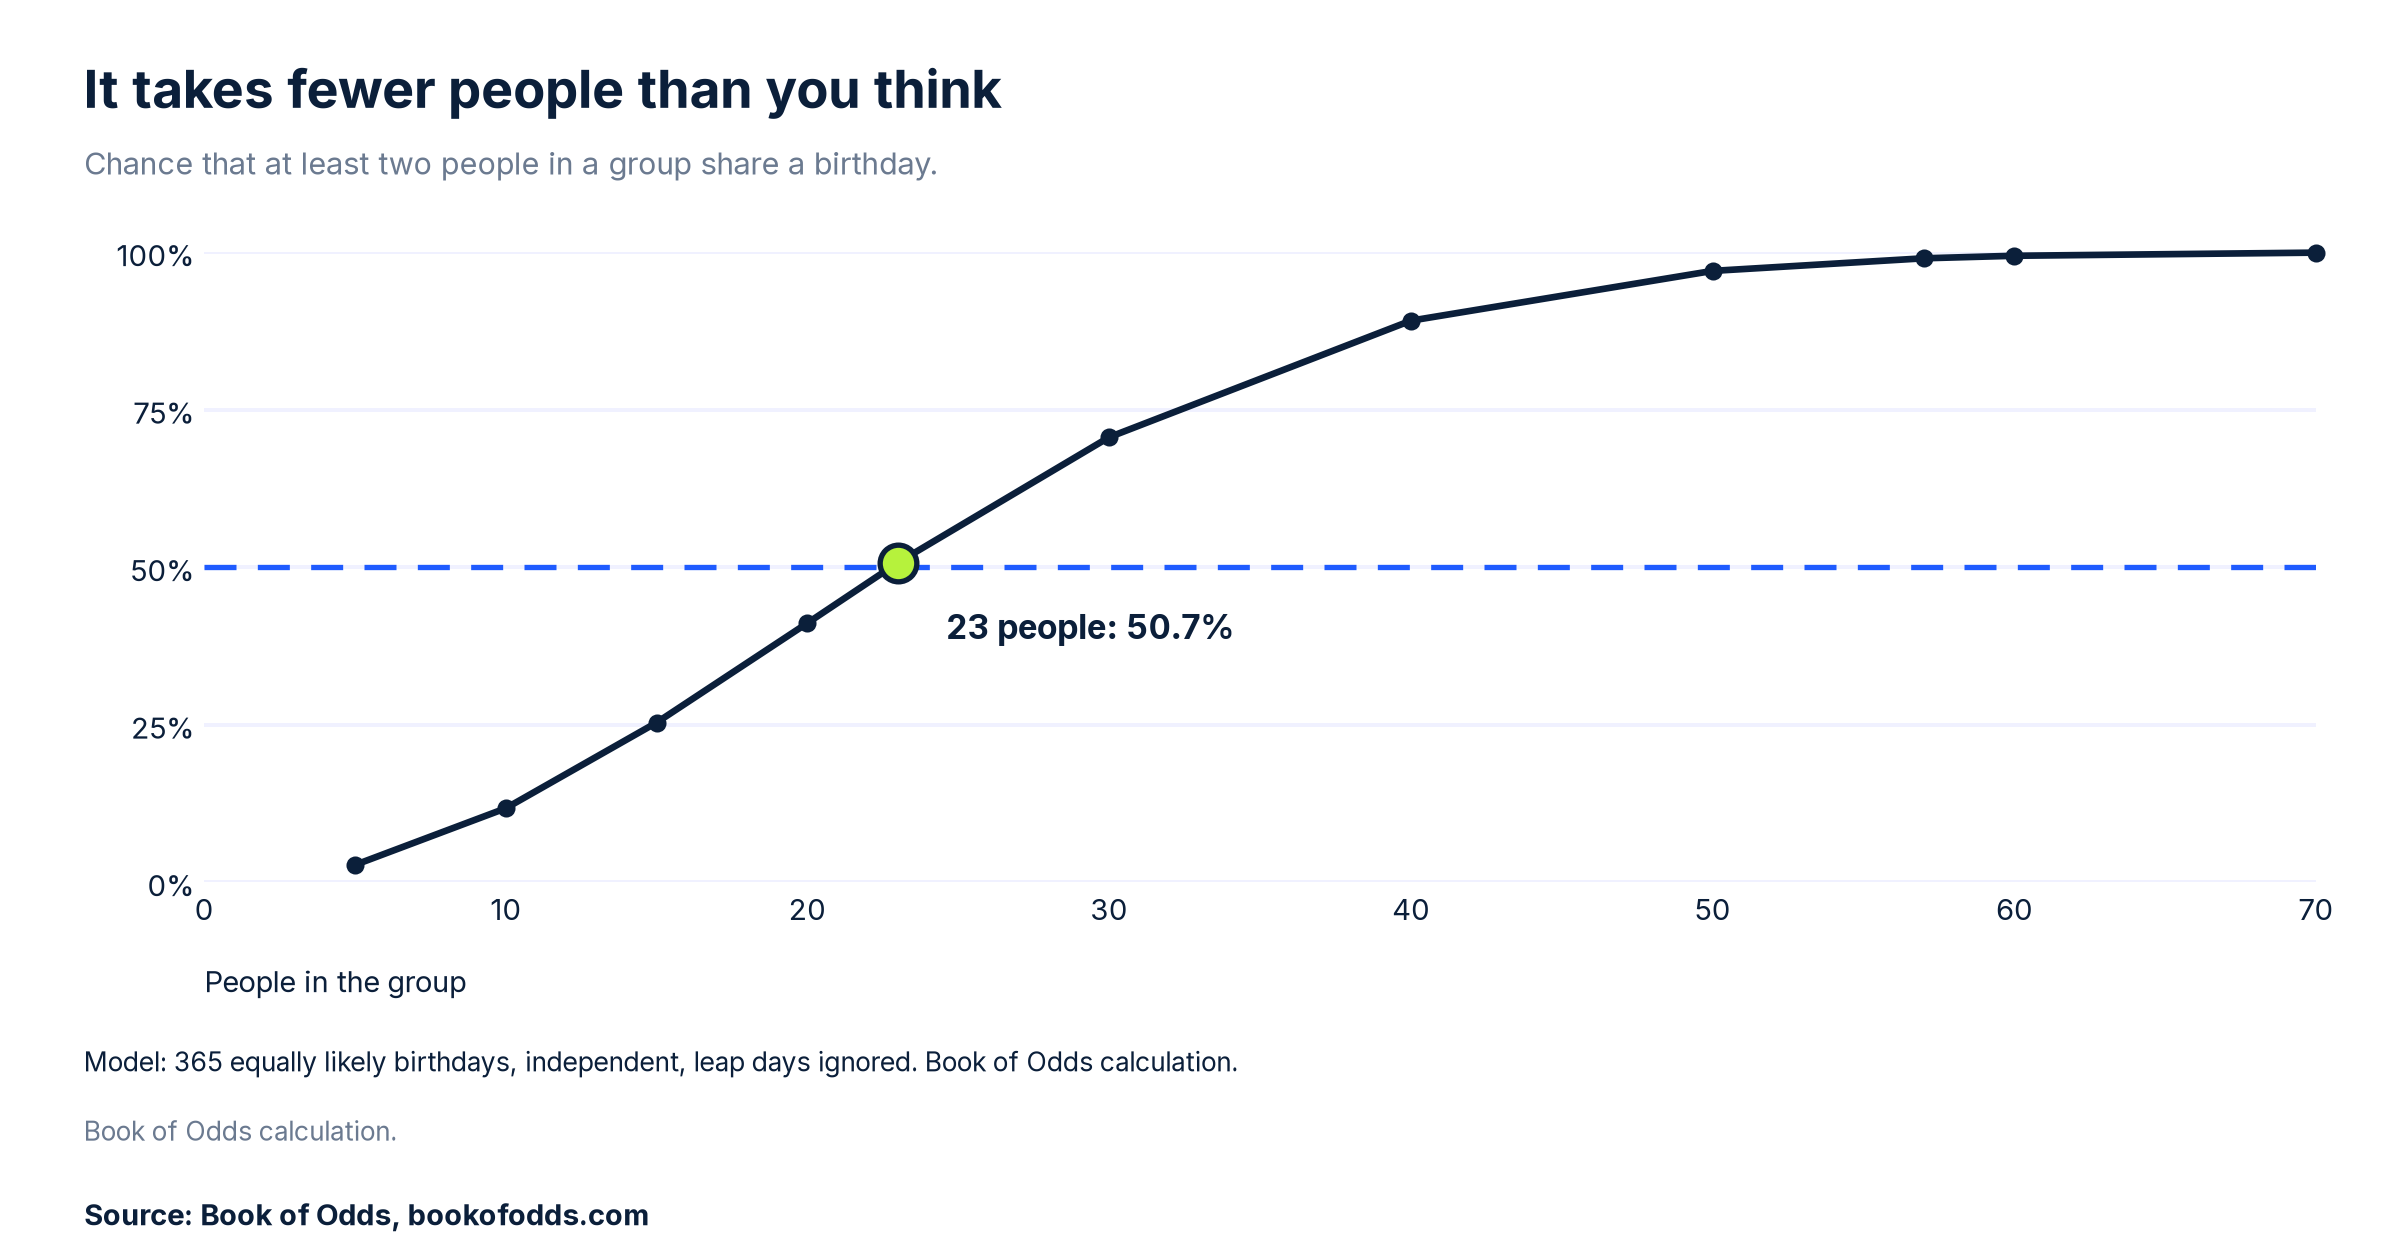
Under the textbook model, the chance of at least one shared birthday rises steeply with group size.
- 10 people: about 11.7%
- 20 people: about 41.1%
- 23 people: about 50.7%
- 30 people: about 70.6%
- 40 people: about 89.1%
- 50 people: about 97.0%
- 57 people: about 99.0%
- 70 people: about 99.9%
Put the other way round, 41 people are enough for a 90% chance, 57 for 99% and 70 for 99.9%. The curve flattens long before it reaches the top. A sure thing takes 366 people, because only 365 days are on offer in this model and the 366th person has nowhere new to go. That is a lot of extra guests for the last fraction of a percent.

Real calendars
The textbook model treats every day alike. Real birth records do not. In 2002, NCHS counted 4,021,726 live births in the US. The busiest day was Thursday, September 12, with 13,982 births; the quietest was Christmas Day, with 6,629. That is one year of US births, from the NCHS national table of births by day for 2002.
Unevenness like that can only help a match. A published proof (Berresford, 1980) shows that, for a group of any size, the chance of a shared birthday is lowest when all days are equally likely, so 23 people are enough for better than even odds whatever the real spread of birthdays. The textbook answer is a floor, not a ceiling.
How much does it move? If 23 people were each born on a day of 2002 with that day’s share of US births that year, the chance of a shared birthday would be about 51.9%, against about 50.7% under the textbook model (our arithmetic). With 22 people it would be about 48.8%, so 23 is still the smallest group past 50% (our arithmetic). That calculation assumes everyone was born in 2002 and that each birth is independent of the others; a room of mixed ages blurs the weekday pattern, and twins are left out.
The short version
In a group of 23 people, there is about a 51% chance that at least two share a birthday, if every day of a 365 day year is equally likely and leap days are ignored. The chance that someone in that room shares your own birthday is far lower, about 5.9%. One year of real US birth data, 2002, nudges the group figure up, to about 51.9%, not down. For more puzzles where intuition and arithmetic disagree, see our guide to probability.
Last checked: 2026-10-19, against Berresford (1980) and NCHS natality data for 2002. This article was machine-checked against the sources above and has not been expert-reviewed. Spotted an error or a newer public figure? Please tell us on our contact page with the article link and we will review it.
Sources
- S1 Geoffrey C. Berresford, “The Uniformity Assumption in the Birthday Problem,” Mathematics Magazine, Vol. 53, No. 5 (November 1980), pp. 286 to 288 (a version of A. G. Munford’s 1977 proof), read from the open copy at https://stat.ethz.ch/education/semesters/as2011/bio/birthday.pdf . Accessed Oct 19, 2026.
- S2 National Center for Health Statistics, Table 1-16, “Live Births by Day of Birth: United States, 2002,” natality final data, 2002. https://archive.cdc.gov/www_cdc_gov/nchs/data/statab/natfinal2002.annvol1_16.pdf . Accessed Oct 19, 2026.
- Method: every percentage, group size and threshold on this page is Book of Odds arithmetic (exact fractions, Python), under the model stated beside it; the 2002 figure uses each day’s share of 2002 US births from S2.