

Which state has the highest tuberculosis rate: California, Texas, New York or Alaska?
Alaska, at 10.4 reported cases per 100,000 people in 2025, according to the CDC’s provisional data. California had the most cases, 2,150, but a rate of 5.5.
Pick your state
Imagine a pub quiz with a laminated map on the wall. The host asks which state has the highest tuberculosis rate, and the next table writes down California. It is a confident answer to a slightly different question.
The answer is the small one
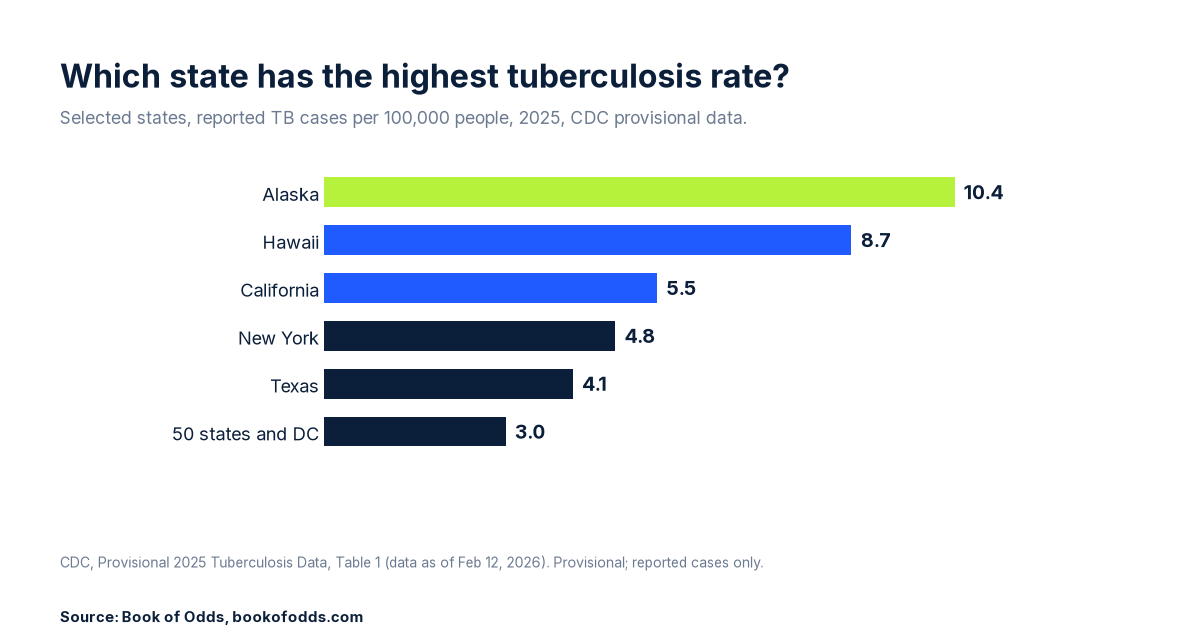
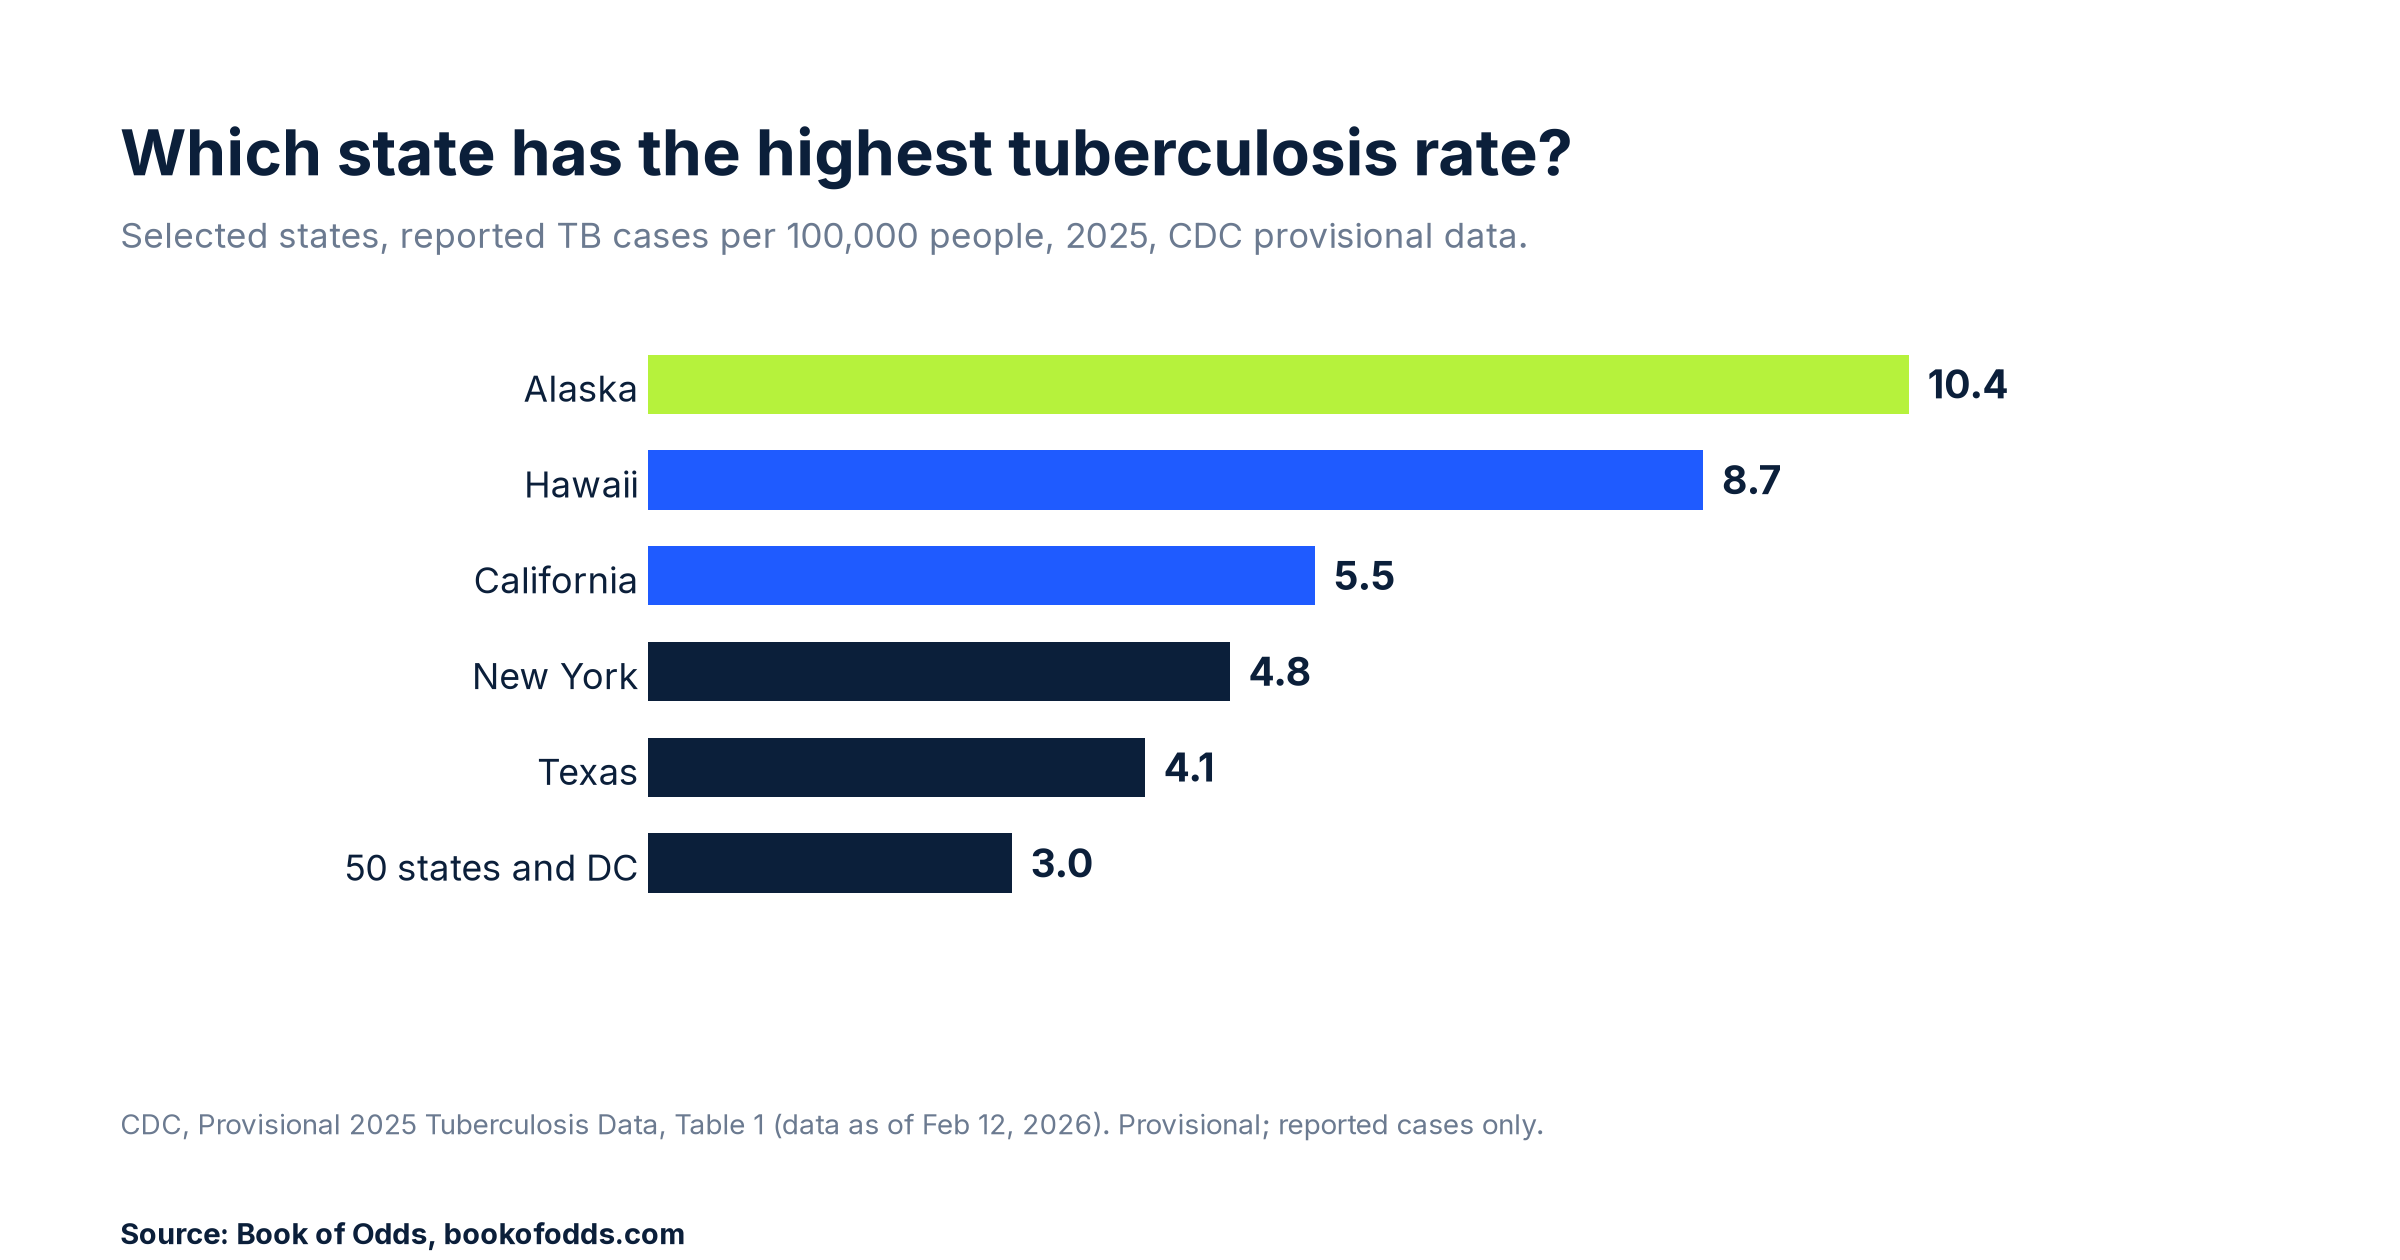
Alaska reported 77 cases in 2025, a rate of 10.4 per 100,000 people. Hawaii was second among the 50 states and DC, with 125 cases and a rate of 8.7. California came third at 5.5, then New York at 4.8 with 967 cases (New York is a single row in this table). Texas, which reported the second most cases, had 1,295 and a rate of 4.1. The 50 states and DC together reported 10,260 cases and a rate of 3.0, the “All” row in CDC’s table.
| State | Reported cases, 2025 | Rate per 100,000 |
|---|---|---|
| Alaska | 77 | 10.4 |
| Hawaii | 125 | 8.7 |
| California | 2,150 | 5.5 |
| New York | 967 | 4.8 |
| Texas | 1,295 | 4.1 |
| 50 states and DC (CDC “All” row) | 10,260 | 3.0 |
The table above shows selected rows only. The “second” and “most cases” labels are our reading of all 51 state and DC rows of CDC’s Table 1. Every number here comes from one table: CDC’s “Provisional 2025 Tuberculosis Data, United States,” Table 1, which counts reported tuberculosis disease cases as of February 12, 2026. Rates are cases per 100,000 people, using Census midyear estimates. The data is provisional, so CDC may revise it.
Counts and rates answer different questions
A count tells you how many cases a state reported. A rate divides that count by the state’s population, which makes a big state and a small one comparable. For another disease where counts and rates pull apart, see dying of cancer.
California reported about 21% of the 10,260 cases in the table, while Alaska reported about 0.8% (our arithmetic: 2,150 divided by 10,260 is 20.96%; 77 divided by 10,260 is 0.75%). Yet Alaska’s rate is about 1.9 times California’s (10.4 divided by 5.5 is 1.89, our arithmetic) and about 3.5 times the combined rate for the 50 states and DC (10.4 divided by 3.0 is 3.47, our arithmetic). The rates are rounded to one decimal place, so those ratios are approximate. Site pages also break out cancer odds by type; see breast and prostate cancer odds.
Making 10.4 feel real
This is a way to picture the rate, not anyone’s personal risk. Imagine 10,000 Alaskans in a stadium. At the 2025 provisional rate, about one of them would be among the reported cases that year (our arithmetic: 100,000 divided by 10.4 is about 9,600). In California you would need about 18,000 people to find one, and across the 50 states and DC about 33,000 (100,000 divided by 5.5 is 18,182; divided by 3.0 is 33,333). That is reported cases per resident per year.
Small numbers swing
Alaska’s case count is small, so its rate is sensitive to small changes in that count. In the 2024 column of the same table, Alaska had 90 cases and a rate of 12.2. (CDC’s separate final 2024 report lists 91 and 12.3; we use the 2024 column of this table so both years come from one source.) In 2025 it had 77 and 10.4, which is 13 fewer cases (our arithmetic: 90 minus 77). In our reading (inference), a change that size would barely register in a state with thousands of cases, but it moved Alaska’s rate by 1.8 points (12.2 minus 10.4, our arithmetic). For contrast, Wyoming reported no cases in 2025 and Vermont 4. Alaska led in 2025. The table does not say it always will.
What this data cannot tell you
These are reported TB disease cases; latent TB infection is not counted here. The 2025 numbers are provisional. CDC says the annual surveillance report is typically released later in the fall, so these figures may change. We found no reason for Alaska’s rate on CDC’s page, and we do not guess at one. CDC’s background text says, “Most people in the United States are at low risk for TB.” For questions about symptoms, testing or treatment, CDC’s tuberculosis pages and a clinician are the place to go, not an odds article. For a condition measured as a repeat risk rather than a state rate, see heart attack: not a one-time event for many.
So, which state?
California has the most tuberculosis cases. Alaska has the highest rate: 10.4 reported cases per 100,000 people in 2025, against 3.0 for the 50 states and DC combined, in CDC’s provisional data.
Sources and method
- CDC, Provisional 2025 Tuberculosis Data, United States (page dated Mar. 23, 2026; data reported to the National Tuberculosis Surveillance System as of Feb. 12, 2026), accessed Oct. 18, 2026: https://www.cdc.gov/tb-data/aboutprovisionaldata/2025-provisional-data.html
Method: counts and rates are CDC’s printed figures from Table 1 for 2025, plus the 2024 column of the same table for Alaska. CDC’s final 2024 report (https://www.cdc.gov/tb-surveillance-report-2024/data/reporting-areas.html) lists Alaska at 91 cases and 12.3, slightly different from the 2024 column of Table 1; we do not mix the two. CDC’s final reports list New York City separately from New York State, while Table 1 has one New York row, which appears to include New York City (our reading). The ratios, the 21% and 0.8% shares, the people-per-case figures, the 13-case difference and the 1.8-point change are our arithmetic. 10.4 divided by 5.5 is 1.89. 10.4 divided by 3.0 is 3.47. 2,150 divided by 10,260 is 20.96 percent. 77 divided by 10,260 is 0.75 percent. 100,000 divided by 10.4 is 9,615. 100,000 divided by 5.5 is 18,182. 100,000 divided by 3.0 is 33,333.
Last checked and corrections
Last checked: 2026-10-19. This article was machine-checked against the sources above and has not been expert-reviewed. Spotted an error or a newer public figure? Please tell us on our contact page with the article link and we will review it.