The short answer
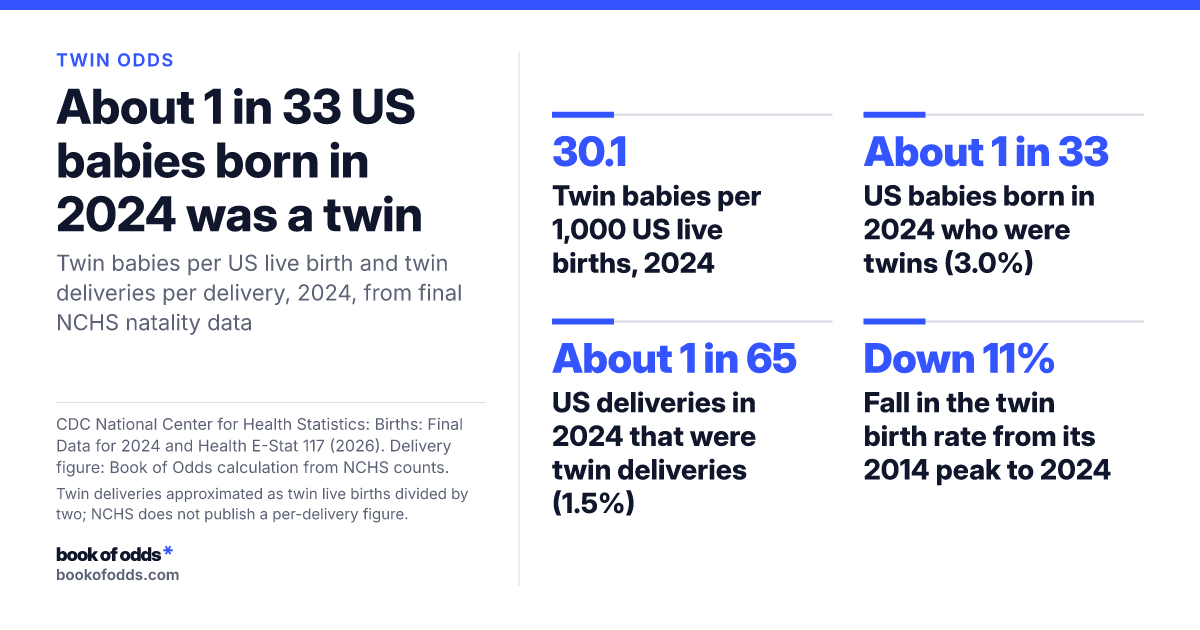
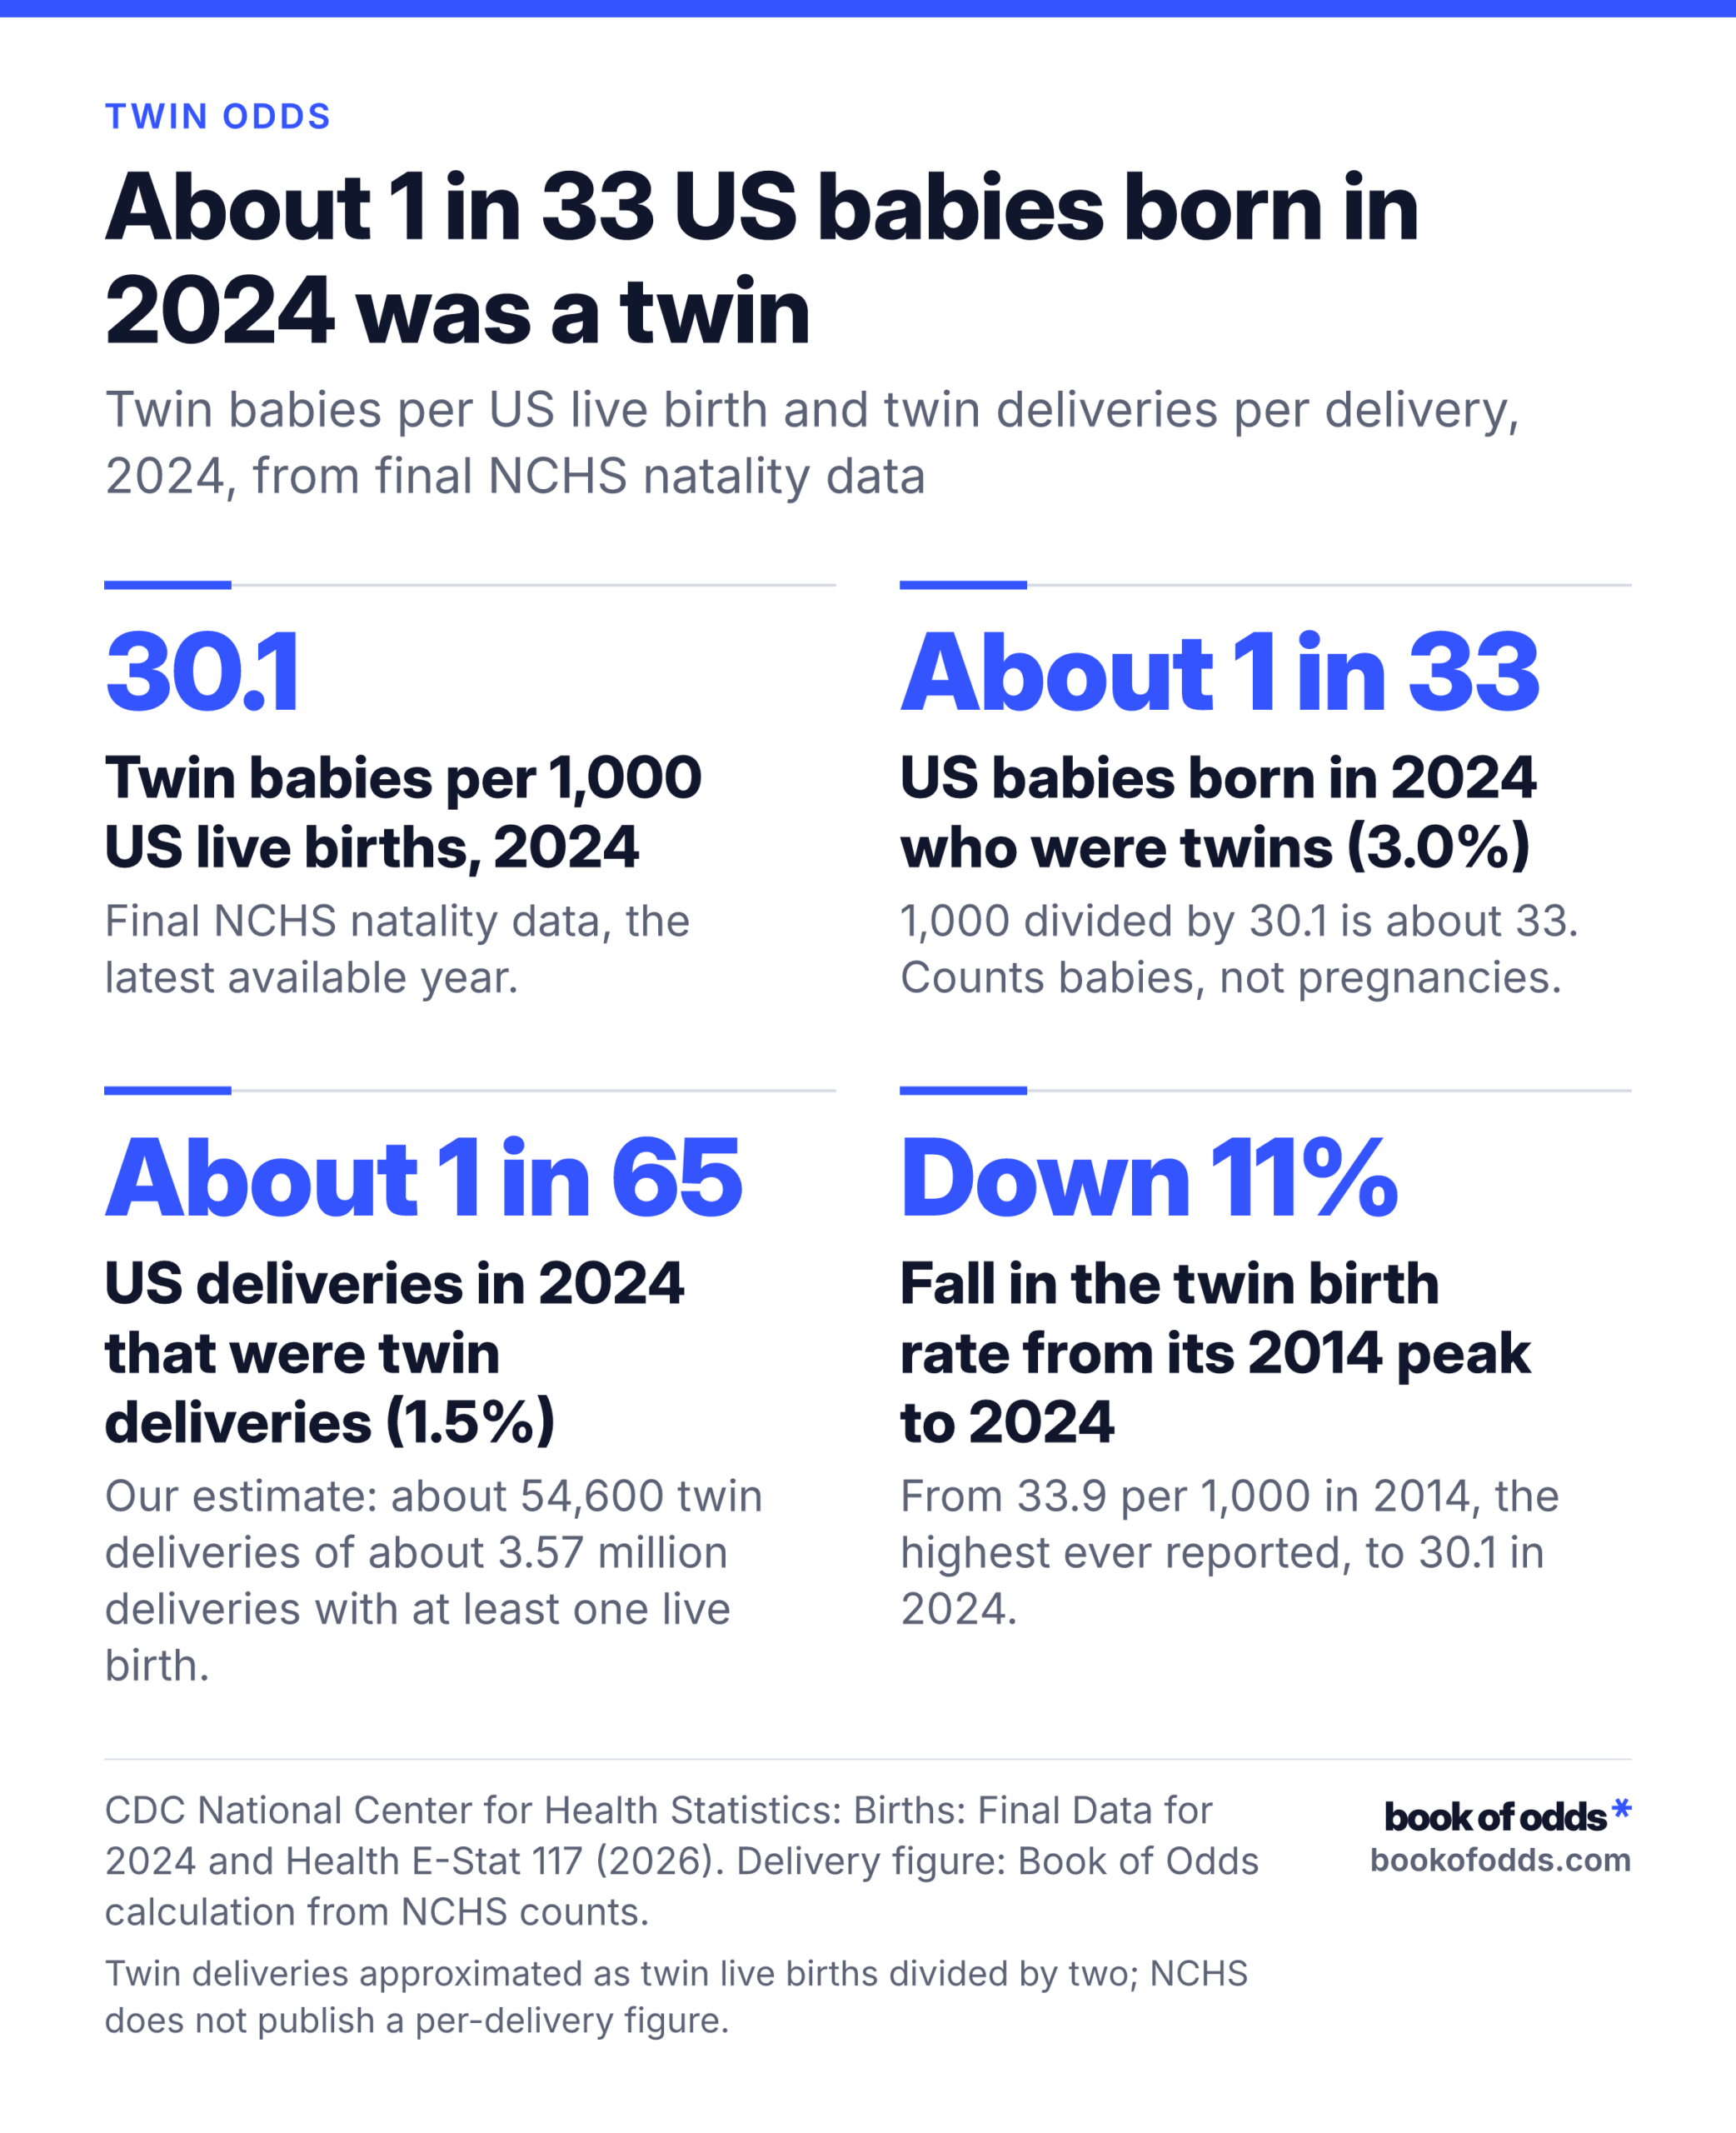
About 1 in 33 US babies born in 2024 was a twin. The CDC’s National Center for Health Statistics (NCHS) counted 30.1 twin births for every 1,000 live births that year, the latest final data. That is 3.0% of babies. To get the “1 in” form, divide 1,000 by 30.1. You get about 33.
Count deliveries instead of babies and the figure roughly halves: about 1 in 65 deliveries with at least one live birth (1.5%) was a twin delivery. NCHS does not publish that number. We worked it out from its counts, as the next section shows.
Twins are also less common than they were a decade ago. The twin birth rate peaked in 2014 and has fallen 11% since.
One thing these figures are not: the chance that a particular pregnancy is twins. They describe how births actually turned out across the whole country in one year.
Babies, deliveries and pregnancies are three different counts
“Twin rate” sounds like one number. It can mean three, and they are not interchangeable.
- Babies. NCHS defines a twin birth as each live birth in a twin pregnancy, and the twin birth rate as twin births per 1,000 total births. This rate counts babies: a set of twins adds two to the count. This is the 30.1 per 1,000, or about 1 in 33 babies.
- Deliveries. A twin delivery is one set. In 2024 there were 109,195 twin babies out of 3,628,934 total live births. Halve the twins and you get about 54,600 twin deliveries, out of about 3.57 million deliveries with at least one live birth. That is 1.5%, or about 1 in 65. Halving is approximate: if one twin is stillborn, that set adds only one live birth.
- Pregnancies. More pregnancies start as twins than end as twin births. Clinical studies estimate that 15% to 35% of twin pregnancies seen on an early ultrasound become a “vanishing twin” and end with one fetus.
That vanishing-twin range is broad. It shifts with how early the ultrasound is done and with fertility treatment, and it comes from clinical studies, not a national count. No source gives the number of US pregnancies that start as twins, so this page does not estimate one.
Twins are getting less common: the rise to 2014 and a decade of decline
For a long time, not much happened. From 1915 through the 1970s, multiple births (twins, triplets and more) held roughly steady as a share of all US births.
Then came the climb. In 1980 the twin birth rate was 18.9 per 1,000, or 1 in 53 babies. By 2009 it was 33.2, a rise of 76%. It stayed roughly level for a few years after that, then reached 33.9 in 2014, or 1 in 29 babies. That was the highest rate ever reported, 79% above 1980.
Since then the rate has slipped by about 1% a year. In 2024 it was 30.1 per 1,000, 11% below the peak. The number of twin births fell further, from 135,336 in 2014 to 109,195 in 2024. The 2023 rate of 30.7 was already the lowest in more than 20 years, and 2024 came in lower still.
Why the decline? NCHS describes it but has not stated a cause. We don’t assign one either.
How the mother’s age affects the odds
View the data table
| Outcome | |
|---|---|
| Under 20 (2024) | 16.1000 |
| 20-24 (2024) | 22.7000 |
| 25-29 (2024) | 28.9000 |
| 30-34 (2024) | 33.2000 |
| 35-39 (2024) | 35.4000 |
| 40 and older (2024) | 35.6000 |
| 40 and older (2014, for comparison) | 66 |
Twin rates still rise with the mother’s age. In 2024 they ran from 16.1 per 1,000 births for mothers under 20, to 22.7 at ages 20-24, 28.9 at 25-29, 33.2 at 30-34, 35.4 at 35-39 and 35.6 for mothers 40 and older.
The surprise is at the top. In 2014, mothers 40 and older had a twin birth rate of 66.0 per 1,000. By 2024 that had fallen 46%, to 35.6. Rates for mothers under 25 did not change significantly over the same decade. So the steep climb with age has mostly flattened: above 30, the three age groups now sit within a few points of each other (33.2, 35.4 and 35.6).
Age also explains less of the long rise than people tend to assume. NCHS used age standardization, which asks what the 2009 rate would have been if mothers had the same age mix as in 1980. Older mothers accounted for only about one-third of the 1980 to 2009 rise. NCHS named infertility treatments as another factor but did not put a number on the remainder.
All of these are associations. They describe groups of births, not what any one mother’s age does to her chances.
Fertility treatment: what the dated estimates show
Fertility treatment comes in two broad kinds. Assisted reproductive technology (ART) means IVF-type procedures, where eggs and embryos are handled in a lab. Other treatments, such as ovulation induction (medication that stimulates ovulation), are not ART.
Two estimates exist. Each describes one year and one scope, so read each that way:
- 2011, all treatments. A CDC-led national analysis in the New England Journal of Medicine estimated that 36% of US twin births came from fertility treatment: about 17% from IVF and the rest from non-IVF treatments. It is a model-based estimate adjusted for maternal age.
- 2018, ART only. CDC’s ART surveillance found that ART contributed 12.5% of all US twin births. Among babies conceived through ART, 20.7% were twins, while about 3.3% of all US infants were multiples.
No estimate since 2011 covers all fertility treatments, including non-IVF ones. So this page draws no conclusion about how many of today’s twins trace to fertility treatment, or whether treatment explains most of them.
Differences by race and ethnicity
View the data table
| Outcome | |
|---|---|
| Non-Hispanic Black | 42 |
| Non-Hispanic White | 31.3000 |
| American Indian and Alaska Native | 26.1000 |
| Native Hawaiian and Other Pacific Islander | 24.5000 |
| Hispanic | 23.4000 |
| Asian | 23.3000 |
The differences here are large. In 2024, non-Hispanic Black mothers had the highest twin birth rate, 42.0 per 1,000 births. Next came non-Hispanic White mothers at 31.3, American Indian and Alaska Native mothers at 26.1, Native Hawaiian and Other Pacific Islander mothers at 24.5, Hispanic mothers at 23.4 and Asian mothers at 23.3.
The Black versus White gap has moved over time. Black mothers historically had higher twin rates. By 2009 the gap had nearly closed: 38.0 per 1,000 for Black mothers versus 37.0 for White mothers. Then it reopened. From 2014 to 2024 the White rate fell 15%, while the Black rate rose 5%, from 40.0 to 42.0.
Two cautions. The 2009 figures use an older way of classifying race (bridged race) than the later figures (single race), so that comparison is close but not exact. And these are associations: the data show that rates differ, not why.
Identical versus fraternal twins
Identical (monozygotic) twins start as one fertilized egg that splits in two. Fraternal (dizygotic) twins start as two separate eggs, each fertilized. Genetically, fraternal twins are ordinary siblings who happened to arrive together.
Identical twinning is the steady one. It happens at about 3.5 to 4 pairs per 1,000 births, fairly constant across populations, over time and with the mother’s age. Note that this rate counts pairs, not babies. Differences in twin rates between groups and over the years come mostly from fraternal twinning.
Among naturally conceived twins, roughly 30% are identical and 70% fraternal. Treat that as a rough figure: clinical reviews state it for twin pregnancies in general, and it is applied to twins conceived without treatment. No source we found gives the split for all current US twins. About two-thirds of identical twins share one placenta.
Do twins run in families?
Fraternal twins do, to a degree. Family studies find that the mothers, sisters and daughters of a woman who had fraternal twins have about twice the general population’s chance of conceiving twins. Identical twinning rarely runs in families, which fits its steady rate.
Treat “about twice” as approximate. It comes from older family studies outside the United States, cited in a 2024 study of Nigerian mothers of fraternal twins. We found no US-specific estimate.
What these numbers can’t tell you
These national shares are not a personal probability for any one pregnancy, which depends on age, fertility treatment, race, family history and more. The age and race differences are associations, not causes. The fertility-treatment figures describe 2011 and 2018 only. This page gives no tips for conceiving twins and no medical advice.
If your question is about a baby’s sex rather than the number of babies, see the odds of having same-sex kids in a row.
Sources
The “about 1 in 33 babies” restatement and the twin-delivery figures are our own calculations from NCHS counts.