

Which kills more people in the United States on average: a tornado, a flood, a heat wave or lightning?
Heat, by a wide margin. The National Weather Service (NWS) counts an average of 273 heat deaths a year for 2015 to 2024, against 114 for floods, 48 for tornadoes and 20 for lightning.
Place your bet
Imagine four cards face down on a table: tornado, flood, heat, lightning. You are asked to turn over the one that has killed the most people a year, on average, over the past ten years. Pick before you read on.
The number that carries the piece: 273
The NWS publishes one table that puts all four hazards side by side, built from Storm Data, its record of weather events and their effects. The unit in every cell is deaths in a year, across the 50 states, Puerto Rico, Guam and the Virgin Islands.
| Hazard | 10-year average (2015 to 2024) | 30-year average (1995 to 2024) | 2024 |
|---|---|---|---|
| Heat | 273 | 211 | 529 |
| Flood (flash and river) | 114 | 89 | 149 |
| Tornado | 48 | 72 | 52 |
| Lightning | 20 | 34 | 14 |
The order is the same in both averages: heat, flood, tornado, lightning. One year props up the 30-year heat figure: 1995 alone had 1,021 heat deaths, and without it the average is about 183 a year (our arithmetic). Dividing, heat’s 10-year average is about 5.7 times the tornado’s, and about 2.9 times in the 30-year version. (Our arithmetic, not the NWS’s.) Flood here means flash flood plus river flood, which is how the NWS reports it for 2024 (119 plus 30). For another hazard comparison, see lightning deaths next to sharks and rip currents.
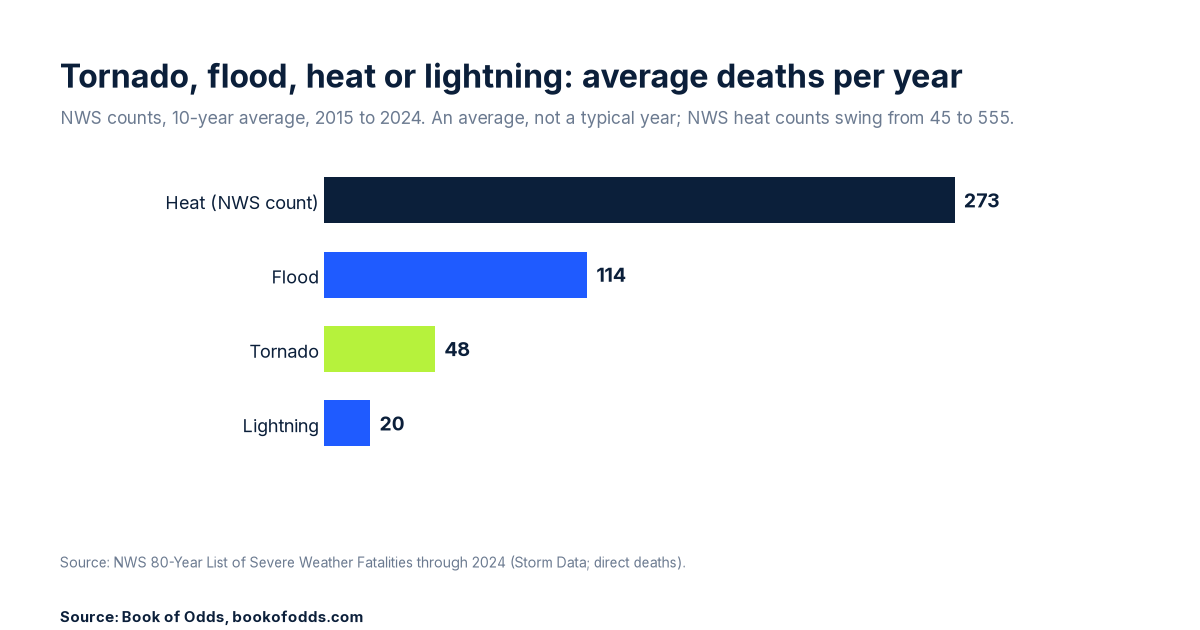
In the 10-year window, heat’s lead is recent. From 2015 to 2019 the NWS counted about 108 heat deaths a year (our averages of the table’s yearly figures), fewer than the roughly 124 for floods. From 2020 to 2024 it counted about 438. The 10-year heat average of 273 is mostly the last five years.
The tornado twist
A tornado count is not a body count, and 2024 shows it. The NWS Storm Prediction Center counts about 1,800 tornadoes in 2024, the second most on record since 1950. The NWS table lists 52 tornado deaths, below the 30-year average of 72.
Deaths swing wildly. The same table shows 10 tornado deaths in 2018, 104 in 2021 and, going back, 553 in 2011.
Where the tornado deaths happened
Here is the comparison worth repeating at dinner. About 1 in 20 occupied homes in the US is a Census mobile home (5.1% in 2019 to 2023, our division of Census figures); the NWS category is ‘mobile or trailer home’ and may not match. Of the 482 tornado deaths the NWS counted from 2015 to 2024, 232 happened in a mobile or trailer home. That is 48.1%, nearly half. Another 134 deaths, 27.8%, were in permanent homes.
So a type of home that is about 5% of the total accounted for about 48% of the deaths, roughly nine times its share. That is a comparison of shares, not of risk per household: it does not account for where tornadoes strike or what shelter was available. It fits the idea that housing type matters, but these counts cannot separate that from where the tornadoes struck.
What this does not tell you
The NWS count is not the death-certificate count. For 2023 the NWS table lists 555 heat deaths. A study of CDC death certificates, using provisional 2023 data, found 2,325 deaths with heat as an underlying or contributing cause that same year. The two follow different rules. NWS Storm Data counts direct deaths in its official statistics, and for heat that means heat illness as the primary or major contributing factor (NWS Instruction 10-1605). We read the table that way, which is our inference. The NWS says the CDC is the official source for cause of death. We do not have a CDC count for the other three hazards on the same basis, so the ranking above is the NWS’s ranking, not a final verdict.
It is deaths, not risk. Nothing here adjusts for how many people were outdoors, in a flood plain or in a mobile home, or for how long.
Years matter. The 2025 NWS figures are preliminary, and in them floods lead with 230 deaths, followed by heat (100), tornadoes (67) and lightning (20). Heat leads in both averages, in 2024 and in each year from 2020 to 2024, but not in every year of the record.
Two NOAA tallies differ slightly. The Storm Prediction Center’s year in review gives 54 direct tornado deaths for 2024, the NWS table 52. We use the NWS table throughout so that all four hazards share one basis.
“Mobile or trailer home” and the Census “mobile home” may not be the same set. The Census share is a 2019 to 2023 five-year survey estimate of occupied housing units, with a margin of error, and the NWS tables record where each victim was.
Back to the four cards
Turn over heat: 273 deaths a year on average, 2015 to 2024, in the NWS count. The tornado is third, at 48.
Sources and method
- NWS, Summary of Natural Hazard Statistics for 2024 in the United States (report generated March 24, 2026), accessed October 18, 2026: https://www.weather.gov/media/hazstat/sum24.pdf
- NWS, 80-Year List of Severe Weather Fatalities (through 2024, with 10-year and 30-year averages), accessed October 18, 2026: https://www.weather.gov/media/hazstat/80year_2024.pdf
- NWS, Summary of Natural Hazard Statistics for 2025 in the United States (preliminary, generated July 8, 2026), accessed October 18, 2026: https://www.weather.gov/media/hazstat/sum25.pdf
- NWS, Tornado Fatalities by State and Location, 2015 to 2024 (one file per year, tornado15.pdf to tornado24.pdf), accessed October 18, 2026: https://www.weather.gov/media/hazstat/tornado24.pdf (swap the last two digits for other years)
- NWS hazard statistics landing page, accessed October 18, 2026: https://www.weather.gov/hazstat/
- NWS Instruction 10-1605, Storm Data Preparation (July 26, 2021), definitions of direct and indirect fatalities: https://www.weather.gov/media/directives/010_pdfs/pd01016005curr.pdf
- NOAA Storm Prediction Center, 2024 Year in Review, accessed October 18, 2026: https://www.spc.noaa.gov/media/year-in-review/2024/
- Howard JT et al., “Trends of Heat-Related Deaths in the US, 1999 to 2023,” JAMA (published online August 26, 2024), from CDC WONDER data, accessed October 18, 2026: https://jamanetwork.com/journals/jama/fullarticle/2822854
- US Census Bureau, American Community Survey 2019 to 2023 five-year estimates, table B25032 (tenure by units in structure), accessed October 18, 2026: https://data.census.gov/table/ACSDT5Y2023.B25032
Method: averages and 2024 figures are the NWS’s. The 10-year averages (2015 to 2024) reproduce from the yearly rows. Our own arithmetic: the 5.7 and 2.9 ratios, the 2015 to 2019 and 2020 to 2024 heat averages, the 482, 232 and 134 location totals (the sum of ten yearly NWS location tables), the 48.1% and 27.8% shares, and the 5.1% mobile home share (4,784,233 owner-occupied plus 1,775,144 renter-occupied mobile homes, divided by 127,482,865 occupied units).
Last checked and corrections
Last checked: October 18, 2026. This article was machine-checked against the sources above and has not been expert-reviewed. Spotted an error or a newer public figure? Please tell us on our contact page with the article link and we will review it.