

Per mile driven, who has the better crash record: women, men, or does it depend on what you count?
It depends on what you count. Count fatal crashes and women have the lower rate: 1.9 drivers involved per 100 million miles in 2022, against 2.8 for men, according to the Insurance Institute for Highway Safety (IIHS). Count every police-reported crash and, by our arithmetic from federal crash data, men have the lower rate: 4.73 per million miles, against 5.68 for women.
No official source publishes that second split. We built it from the National Highway Traffic Safety Administration’s (NHTSA) national sample of police-reported crashes and the same miles IIHS uses. The same method reproduces 14 of IIHS’s 15 published all crash rates by age exactly.
What each number counts
Every rate on this page is for US drivers in 2022 and uses miles from the 2022 National Household Travel Survey, the federal survey IIHS uses for miles driven. There are three counts, all for drivers of passenger vehicles.
The first is IIHS’s: drivers involved in fatal crashes per 100 million miles. “Involved” means the driver’s vehicle was in a crash in which someone died; it does not say who died or who caused it. The second, driver deaths per 100 million miles, and the third, all police-reported crash involvements per million miles, are our arithmetic from NHTSA’s public data files over the same miles. The word “involved,” in other words, is doing a lot of careful lifting.
Fatal crashes and driver deaths
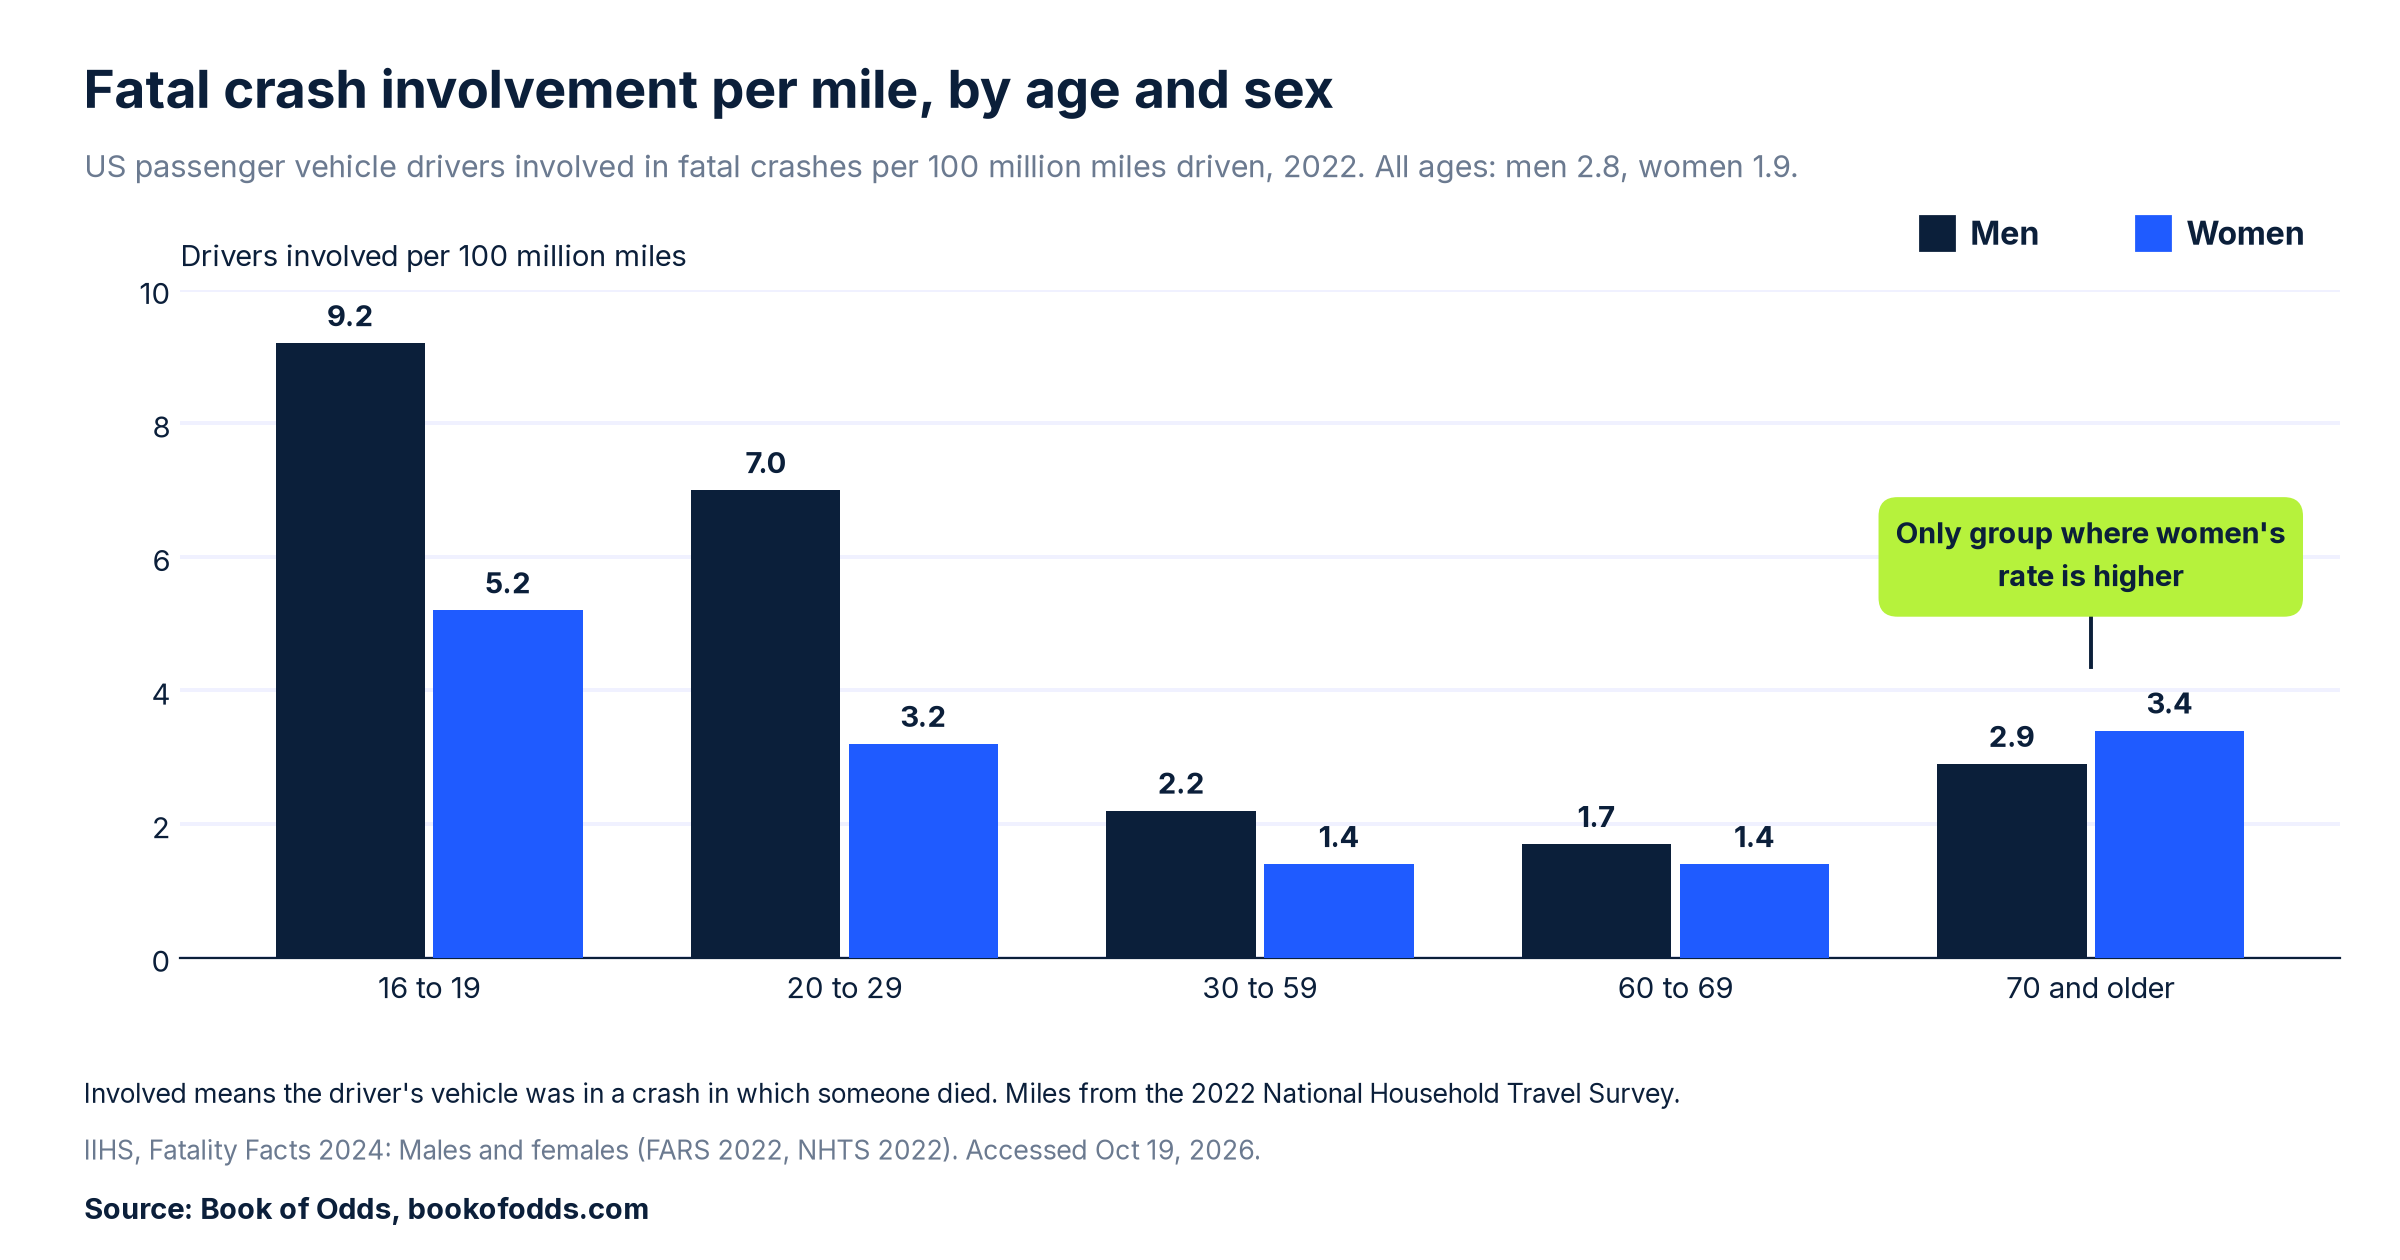
Per mile, men were involved in fatal crashes at a rate IIHS puts at 48% higher than women’s: 2.8 against 1.9 per 100 million miles in 2022. That rests on 30,956 men and 14,034 women involved in fatal crashes that year.
Counting only the drivers who died, the order holds. By our arithmetic from NHTSA’s 2022 fatal crash data (FARS), 13,903 male and 5,468 female passenger vehicle drivers aged 16 and older were killed, or 1.26 and 0.74 per 100 million miles, so men’s rate was about 1.7 times women’s. IIHS does not publish this rate per mile. IIHS notes: “Crashes involving male drivers often are more severe than those involving female drivers.”
Age, and the flip at 70
The gap depends heavily on age. Men’s fatal crash involvement rate per mile is higher in every age group from 16 to 69, and in the 20s it is more than double women’s, by our arithmetic the widest ratio of any group.
- 16 to 19: men 9.2, women 5.2 per 100 million miles
- 20 to 29: men 7.0, women 3.2
- 30 to 59: men 2.2, women 1.4
- 60 to 69: men 1.7, women 1.4
- 70 and older: men 2.9, women 3.4
At 70 and older the order flips, the only age group where women’s rate is higher. IIHS puts the rise in older drivers’ fatal crash rates largely down to “increased susceptibility to injuries,” rather than “an increased tendency to get into crashes.” IIHS does not say why women’s rate is the higher one at that age.

All police-reported crashes
Count crashes of every severity and the picture changes. The figures in this section are our arithmetic from NHTSA’s 2022 sample of police-reported crashes, a split by sex that no official source publishes. By that count, women’s rate of involvement in police-reported crashes of any severity is higher than men’s in every age group except 20 to 29. Per million miles, it is 23.2 for women and 19.8 for men at 16 to 19, 10.5 and 12.7 at 20 to 29, 4.4 and 3.8 at 30 to 59, 3.8 and 2.7 at 60 to 69, and 6.0 and 3.1 at 70 and older.
What the numbers do not say
A police report is not a verdict: being involved in a crash does not mean causing it. None of these figures measures fault, and none of the sources used here explains why women’s all crash rate is higher. So this page does not offer a reason.
Data limits
The miles come from a household travel survey, which counts household vehicles only, so these per mile rates do not line up with NHTSA’s national rate and should not be compared with it. 2022 is the latest year with miles by sex, so every rate here is for 2022, even though death counts exist for later years. “Involved in a fatal crash” does not mean the driver died or caused the crash. The all crash figures are our estimate from NHTSA’s weighted sample of police-reported crashes, which leaves out crashes nobody reported and carries sampling error that, by our estimate, is too small to flip any of these orders by sex. The survey miles carry error we have not computed. Survey miles by single age are lumpy, so ages are grouped into wide bands.
The short version
Per mile in 2022, men were involved in more fatal crashes than women, 2.8 against 1.9 per 100 million miles (IIHS), and by our arithmetic men’s driver death rate per mile was higher too, 1.26 against 0.74. By our count, women were involved in more police-reported crashes overall, 5.68 against 4.73 per million miles. Who’s the better driver depends on what you count. When a newer travel survey adds miles for a later year, this page will be rechecked.
Last checked: 2026-10-19, against IIHS Fatality Facts 2024 (Males and females) and NHTSA’s FARS 2022 and CRSS 2022 data files. This article was machine-checked against the sources above and has not been expert-reviewed. Spotted an error or a newer public figure? Please tell us on our contact page with the article link and we will review it.
Sources
- S1 Insurance Institute for Highway Safety, Fatality Facts 2024, “Males and females,” posted June 2026. https://www.iihs.org/research-areas/fatality-statistics/detail/males-and-females . Accessed Oct 19, 2026.
- S2 IIHS, Fatality Facts 2024, “Teenagers” and “Older people,” posted June 2026, and the IIHS topic pages “Teenagers” and “Older drivers.” https://www.iihs.org/research-areas/fatality-statistics/detail/teenagers , https://www.iihs.org/research-areas/fatality-statistics/detail/older-people , https://www.iihs.org/research-areas/teenagers , https://www.iihs.org/research-areas/older-drivers . Accessed Oct 19, 2026.
- S3 Federal Highway Administration, 2022 National Household Travel Survey Data User Guide, V2.0, February 2024. https://nhts.ornl.gov/assets/2022/doc/2022%20NextGen%20NHTS%20User%27s%20Guide%20V2_PubUse.pdf . Accessed Oct 19, 2026.
- S4 NHTSA, Fatality Analysis Reporting System (FARS) 2022 national data files; our tabulation. https://static.nhtsa.gov/nhtsa/downloads/FARS/2022/National/FARS2022NationalCSV.zip . Accessed Oct 19, 2026.
- S5 NHTSA, Crash Report Sampling System (CRSS) 2022 data files; our tabulation. https://static.nhtsa.gov/nhtsa/downloads/CRSS/2022/CRSS2022CSV.zip . Accessed Oct 19, 2026.
- Method: the driver death rates and all crash rates are Book of Odds arithmetic from NHTSA’s public FARS and CRSS files over the miles IIHS publishes from the 2022 National Household Travel Survey; the fatal crash involvement rates are IIHS’s.