

How many magnitude 7 or bigger earthquakes hit the world in a typical year: about 1, about 15 or about 150?
About 15, or a touch more. By long-term records since about 1900, USGS says “we expect about 16 major earthquakes in any given year” worldwide, and “major” means magnitude 7.0 or greater. That is 15 in the magnitude 7 range and one of magnitude 8.0 or greater.
The other two options are real numbers too. About 1 a year is the count at magnitude 8.0 or greater, and earthquakes of magnitude 6 or more averaged about 152 a year worldwide in 2000 to 2021 (our arithmetic from the USGS table).
The yearly counts here are worldwide. The California figures are USGS model estimates for magnitude 6.7 or larger over the 30 years starting from 2014, the national figure is USGS’s share “of the U.S.”, and the death tally is our count of NOAA’s Significant Earthquake Database for the 50 states.
Some years are busier than others
“About 16” is an average, and single years stray from it. In the USGS record, 2010 had 23 major earthquakes, the largest total; 1989 had only 6, and 1988 had 7. The full USGS catalog, small earthquakes included, also grows for a reason that has nothing to do with the Earth. The National Earthquake Information Center now locates about 20,000 earthquakes around the globe each year, about 55 a day, and more are recorded because there are more instruments, not more earthquakes.
Closer to home: California
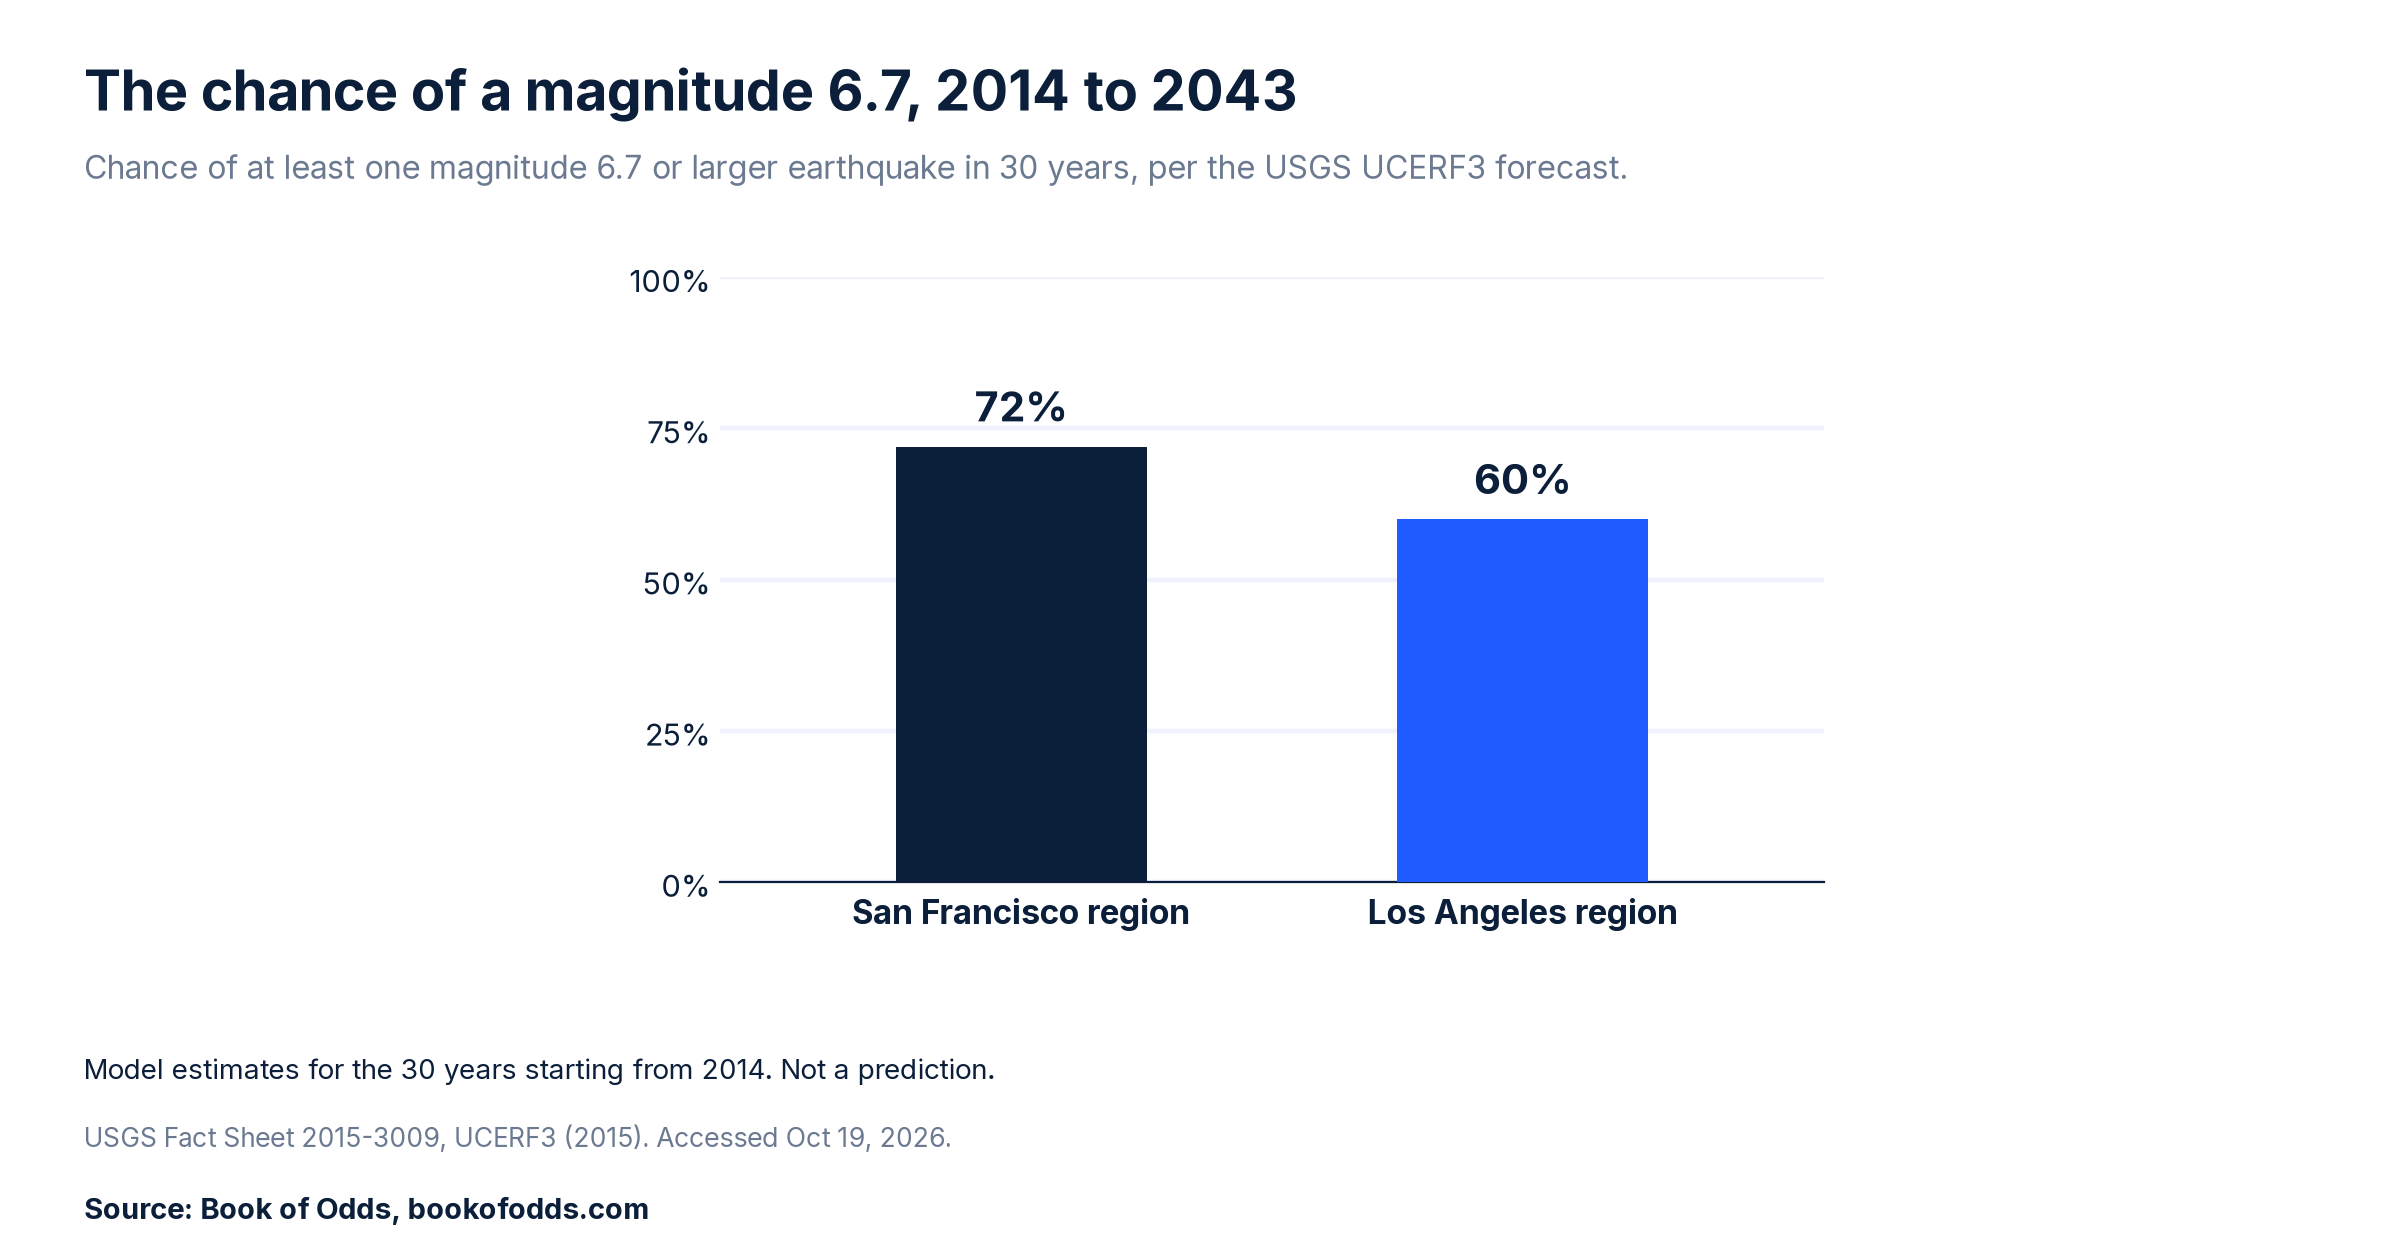
USGS’s UCERF3 forecast put the chance of one or more earthquakes of magnitude 6.7 or larger in the 30 years starting from 2014 at 72% for the San Francisco Bay Area and 60% for the Los Angeles area. The thresholds were chosen on purpose: “6.7 matches the magnitude of the 1994 Northridge earthquake, and 30 years is the typical duration of a homeowner mortgage”.
For its Greater California region as a whole, the same forecast put the chance of at least one magnitude 6.7 or larger earthquake over the same 30 years at “greater than 99 percent”, a chance for the region, not for any one place or person.

These are model estimates for a stated window, not a date on a calendar. In September 2026, news outlets reported a new USGS calculation for the Bay Area; this page uses the figures USGS published.
The national map is not a personal chance
USGS’s 2023 National Seismic Hazard Model maps the likelihood of damaging shaking in the United States over the next 100 years. From it, USGS says “Nearly 75 percent of the U.S. could experience damaging earthquake shaking”. The release does not say whether that share counts land area or people. Either way, it is not the chance that you, or any one person, will feel damaging shaking. USGS puts the limit plainly in the same release: “No one can predict earthquakes.”
After an earthquake
One earthquake does not usually announce a bigger one. USGS says “the likelihood that an earthquake will be followed by a larger earthquake nearby and within a week is about 5%”, a worldwide figure. So about 95% are not followed by a larger one nearby within a week (our arithmetic: 100% minus 5%).
Deaths in US earthquakes
NOAA’s Significant Earthquake Database lists 7 deaths in earthquakes in the 50 states from 2000 to 2025, by our count of its “deaths” field, which NOAA defines as the “Number of Deaths from the Earthquake”. They came from five earthquakes: one in Washington in 2001 and four in California, in 2003, 2014, 2019 and 2022. The count leaves out one death listed only in the database’s separate total for a 2023 Alaska earthquake, which adds tsunami and other secondary effects. It covers the 50 states only, because NOAA codes Puerto Rico and other US territories separately; the database lists 4 deaths in the Jan. 7, 2020, Puerto Rico earthquake, a magnitude 6.4, below this page’s line for “major”. For scale, the same database lists 57 deaths in the 1994 Northridge earthquake alone. This is a tally of one database’s records, not an official death count or a measure of risk.
The number we did not find
We did not find a per person lifetime chance of dying in a US earthquake that we could check against its source.
Data limits
“About 16” is a long-term average from records since about 1900, and single years range widely. The California figures are model estimates for the 30 years starting from 2014. The national figure is a share “of the U.S.” that the USGS release does not define as land area or people, and neither figure is a prediction or a personal chance. The death tally counts NOAA’s “deaths” field, not its separate total; it leaves out entries that NOAA’s own notes describe as mine events or an explosion, and covers the 50 states only. We did not find per person earthquake death odds that we could check.
The short version
By records since about 1900, USGS expects about 16 major earthquakes, magnitude 7.0 or greater, worldwide in any given year. For California, its UCERF3 forecast gave 72% for the Bay Area and 60% for the Los Angeles area, for magnitude 6.7 or larger in the 30 years starting from 2014. A USGS publication of a newer calculation would update this page.
Last checked: 2026-10-19, against USGS earthquake statistics and forecasts and NOAA’s Significant Earthquake Database. This article was machine-checked against the sources above and has not been expert-reviewed. Spotted an error or a newer public figure? Please tell us on our contact page with the article link and we will review it.
Sources
- S1 USGS, “Why are we having so many (or so few) earthquakes? Has naturally occurring earthquake activity been increasing?”, FAQ, updated Feb. 5, 2026. https://www.usgs.gov/faqs/why-are-we-having-so-many-earthquakes-has-naturally-occurring-earthquake-activity-been . Accessed Oct 19, 2026.
- S2 USGS Earthquake Hazards Program, “Lists, Maps, and Statistics” (worldwide counts by magnitude). https://www.usgs.gov/programs/earthquake-hazards/lists-maps-and-statistics . Accessed Oct 19, 2026.
- S3 E. H. Field and the 2014 Working Group on California Earthquake Probabilities, “UCERF3: A new earthquake forecast for California’s complex fault system,” USGS Fact Sheet 2015-3009, March 9, 2015, doi 10.3133/fs20153009. https://pubs.usgs.gov/fs/2015/3009/ ; and USGS Fact Sheet 2016-3020, “Earthquake outlook for the San Francisco Bay region 2014 to 2043,” doi 10.3133/fs20163020. https://doi.org/10.3133/fs20163020 . Accessed Oct 19, 2026.
- S4 USGS, “What is the probability that an earthquake will occur in the Los Angeles Area? In the San Francisco Bay area?”, FAQ. https://www.usgs.gov/faqs/what-probability-earthquake-will-occur-los-angeles-area-san-francisco-bay-area . Accessed Oct 19, 2026.
- S5 USGS, “2023 50-State Long-term National Seismic Hazard Model,” Jan. 2, 2024, and news release “New USGS map shows where damaging earthquakes are most likely to occur in US,” Jan. 16, 2024. https://www.usgs.gov/programs/earthquake-hazards/science/2023-50-state-long-term-national-seismic-hazard-model ; https://www.usgs.gov/news/national-news-release/new-usgs-map-shows-where-damaging-earthquakes-are-most-likely-occur-us . Accessed Oct 19, 2026.
- S6 NOAA National Centers for Environmental Information, NCEI/WDS Global Significant Earthquake Database, doi:10.7289/V5TD9V7K: events coded USA from 1900 (206 events on two pages), https://www.ngdc.noaa.gov/hazel/hazard-service/api/v1/earthquakes?country=USA&minYear=1900 and https://www.ngdc.noaa.gov/hazel/hazard-service/api/v1/earthquakes?country=USA&minYear=1900&page=2 ; events coded USA TERRITORY from 1900 (23 events), https://www.ngdc.noaa.gov/hazel/hazard-service/api/v1/earthquakes?country=USA%20TERRITORY&minYear=1900 ; event records with NOAA’s notes, for example https://www.ngdc.noaa.gov/hazel/hazard-service/api/v1/earthquakes/10467 . Field definitions from the database’s ISO 19115 metadata (gov.noaa.ngdc.mgg.hazards:G012153) and its search page help text. https://www.ngdc.noaa.gov/hazel/view/hazards/earthquake/search . Accessed Oct 19, 2026.
- S7 NBC Bay Area, “New numbers show odds spike for major Bay Area earthquake in next 30 years,” Sept. 2, 2026, updated Sept. 3, 2026, on a USGS calculation first reported by the San Francisco Chronicle. https://www.nbcbayarea.com/news/local/usgs-earthquake-bay-area-study/4136959/ . Accessed Oct 19, 2026.
- Method: the 2000 to 2021 average (about 152 a year) is Book of Odds arithmetic from the S2 table, and the death tally (7) is our count of the S6 records coded USA (the 50 states), using the “deaths” field for earthquakes only; the Puerto Rico figure (4) is the S6 record as listed, not added to it. “About 95%” is 100 minus USGS’s 5%. Forecast and hazard figures are as USGS published them.