
When an airline has an accident, does everyone aboard survive, some of them, or no one?
Almost always, everyone: in about 94% of the Part 121 aircraft (large airline and cargo operations) involved in accidents from 1983 to 2017, 100% of the occupants survived, according to the National Transportation Safety Board (NTSB). The odd part is what happens when the accident is a bad one.
Place your bet
Imagine you are at a gate, and a stranger offers you a wager. An airliner is about to have an accident that sets off a fire, hurts someone badly and wrecks the plane. Everyone survives, some do, or none do. Pick one before reading on. The NTSB has counted, and in 2001 it said one purpose of its first survivability report was to help “dispel a public perception that most air carrier accidents are not survivable.”
The number that carries the piece: 94%
The NTSB studied accidents involving Part 121 operations, which it describes as generally large aircraft operated by airlines and cargo carriers. Its 2020 update covers 1983 through 2017. In its words, “for about 94% of Part 121 aircraft involved in accidents, 100% of the occupants survived.”
That sounds too good until you read the NTSB’s definition of an accident: an occurrence in which any person suffers death or serious injury, or in which the aircraft receives substantial damage. The NTSB says many of these cases were turbulence events that seriously injured one or more occupants but killed no one. Others were bird strikes or collisions between taxiing aircraft, which may substantially damage a plane and rarely injure anyone aboard.
So the 94% is a share of aircraft involved in accidents, not a promise about your flight. It also says nothing about how often accidents happen. For that, the NTSB reports that from 2001 through 2017 the fatal accident rate was 0.006 per 100,000 flight hours, “equivalent to about one fatal Part 121 accident for every 16.3 million flight hours.” One aircraft flying without a break would need roughly 1,860 years to log that many hours. (Our arithmetic, not the NTSB’s.)
One caveat on that rate. The NTSB computes it without intentional acts, such as sabotage or terrorism, while the 4.1% of accidents with a fatality (23 of 564, 2001 to 2017) includes them. Divide the NTSB’s 310,202,650 flight hours for those years by 23 and you get about 13.5 million, not 16.3 million. The two figures count different things.
Now the bad ones
A “serious accident” in its study is a Part 121 passenger flight accident in the United States that involved all three of these: a fire before or after the impact, at least one serious injury or fatality, and an aircraft substantially damaged or destroyed. Thirty-five accidents from 1983 to 2017 met that test.
| Outcome | Accidents | Share of the 35 |
|---|---|---|
| Everyone survived | 10 | 28.6% |
| Some survived, some did not | 16 | 45.7% |
| No one survived | 9 | 25.7% |
The NTSB prints the first and last rows. The middle row is ours: 35 minus 10 minus 9 is 16. It is the largest group, and it is the answer to the stranger’s wager. When the accident is serious, the most common outcome is neither all nor none, but some.
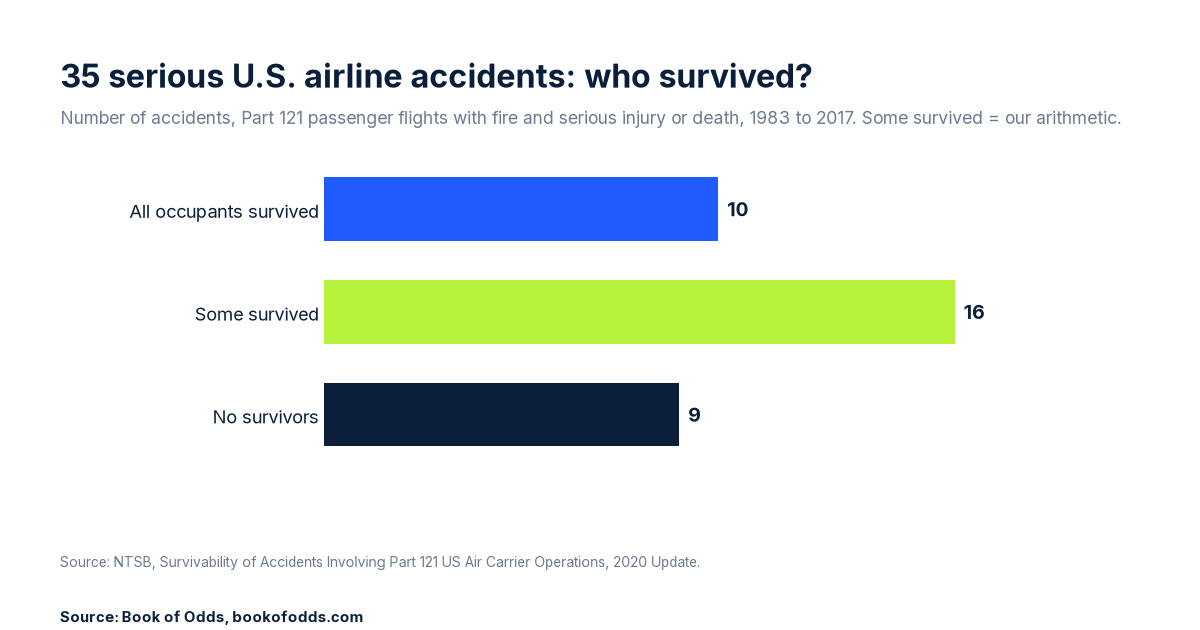
Here is the comparison worth repeating at dinner: “no one survived” happened in 9 and “everyone survived” in 10. Nearly a tie, and both are outnumbered by the middle.
Counting people instead of accidents
Those 35 accidents involved 3,823 occupants. The NTSB reports that 59.0% of them survived: 52.7% with minor or no injury and 6.3% with serious injuries. The rest died: 27.0% from impact, 9.1% from unknown causes, 4.1% from fire or smoke and 0.7% from other causes.
A further cut matters. The NTSB also classified serious accidents as survivable or not. To count as survivable, the forces passed to occupants through the seat and restraints cannot exceed the limits of human tolerance, and the structure around them must remain intact enough to leave a livable space. Among the serious accidents determined to be survivable, 80.8% of occupants survived.
Across all accidents, not only the serious ones, the share of occupants who died fell from 4.2% in 1983 to 2000 (2,280 of 53,953) to 1.3% in 2001 to 2017 (693 of 54,748). In the same two periods, the share of accidents with at least one occupant fatality fell from 12.5% to 4.1%.
What this does not tell you
It is not your odds of an accident. It starts after an accident has already happened, and the only rate we quote is the NTSB’s fatal accident rate above.
It is a small sample. One more or fewer accident in a category moves a lot. Treat 10, 16 and 9 as a count of what happened, not a forecast.
It is a US picture of Part 121 (large airline and cargo) operations. The serious-accident set covers only passenger flights in the United States, and the study looks only at Part 121 operations, not other kinds of flying such as Part 135 or Part 91. It also leaves out intentional acts, such as sabotage or terrorism, which the NTSB includes in its accident counts but excludes from the serious-accident set.
“Survived” is broad. In the 59.0% figure, it includes people who were seriously injured.
It ends in 2017, and the data are current as of March 23, 2020. Our own counts from the NTSB’s public data workbook match the figures above, with one exception: we count 1,095 aircraft where no occupant died, against the NTSB’s 1,096. No published figure changes.
Back at the gate
The stranger’s wager, settled: 10 serious accidents with everyone surviving, 16 with some, 9 with no one. And across every kind of accident it counted, in about 94 of every 100 aircraft involved, all of the occupants survived.
Sources and method
- NTSB, Survivability of Accidents Involving Part 121 US Air Carrier Operations: 2020 Update (data current as of March 23, 2020), accessed October 18, 2026: https://www.ntsb.gov/safety/data/Pages/Part121AccidentSurvivability.aspx
- NTSB public data workbook for that update, Part121Survivability_1983-2017_20200323_Public.xlsx, accessed October 18, 2026: https://www.ntsb.gov/safety/data/Documents/datafiles/Part121Survivability_1983-2017_20200323_Public.xlsx
- NTSB, Survivability of Accidents Involving Part 121 U.S. Air Carrier Operations, 1983 Through 2000 (safety report SR-01-01, adopted March 5, 2001), accessed October 18, 2026: https://www.ntsb.gov/safety/safety-studies/Pages/DCA01SS001.aspx
- Definitions of accident, substantial damage, fatal injury and serious injury come from 49 CFR 830.2, as quoted on the NTSB page above.
Method: percentages are the NTSB’s, except the 16 accidents and 45.7%, which are 35 minus 10 minus 9 and 16 divided by 35. The 1,860 years is 16.3 million hours divided by the 8,766 hours in an average year. The NTSB’s workbook lists aircraft, not accidents (1,169 aircraft in all), so the 94% is a share of aircraft; the NTSB itself calls the 35 serious cases accidents, and each has a unique record ID.
Last checked and corrections
Last checked: October 18, 2026. This article was machine-checked against the sources above and has not been expert-reviewed. Spotted an error or a newer public figure? Please tell us on our contact page with the article link and we will review it.