

How many jobs did Americans born from 1957 to 1964 hold, on average, between ages 18 and 58: about 5, about 8 or about 13?
About 13 (our arithmetic). The Bureau of Labor Statistics puts it at 12.9 jobs from ages 18 to 58 for people born from 1957 to 1964: 13.1 for men and 12.7 for women.
That number counts jobs held, not careers. In this survey, the National Longitudinal Survey of Youth 1979, a job is “an uninterrupted period of work with a particular employer.” BLS calls its jobs “employer-based, not position-based,” and someone who leaves an employer and later returns is counted as holding a new job. Jobs held are also not the same thing as job changes: a first job changes nothing, and two jobs held at once both count (our inference).
Most jobs come early
The “about 5” option was not a random guess. It is roughly how many jobs this group held from 18 to 24 alone: 5.6. In BLS’s words, “Over 40 percent of these jobs were held from ages 18 to 24.”

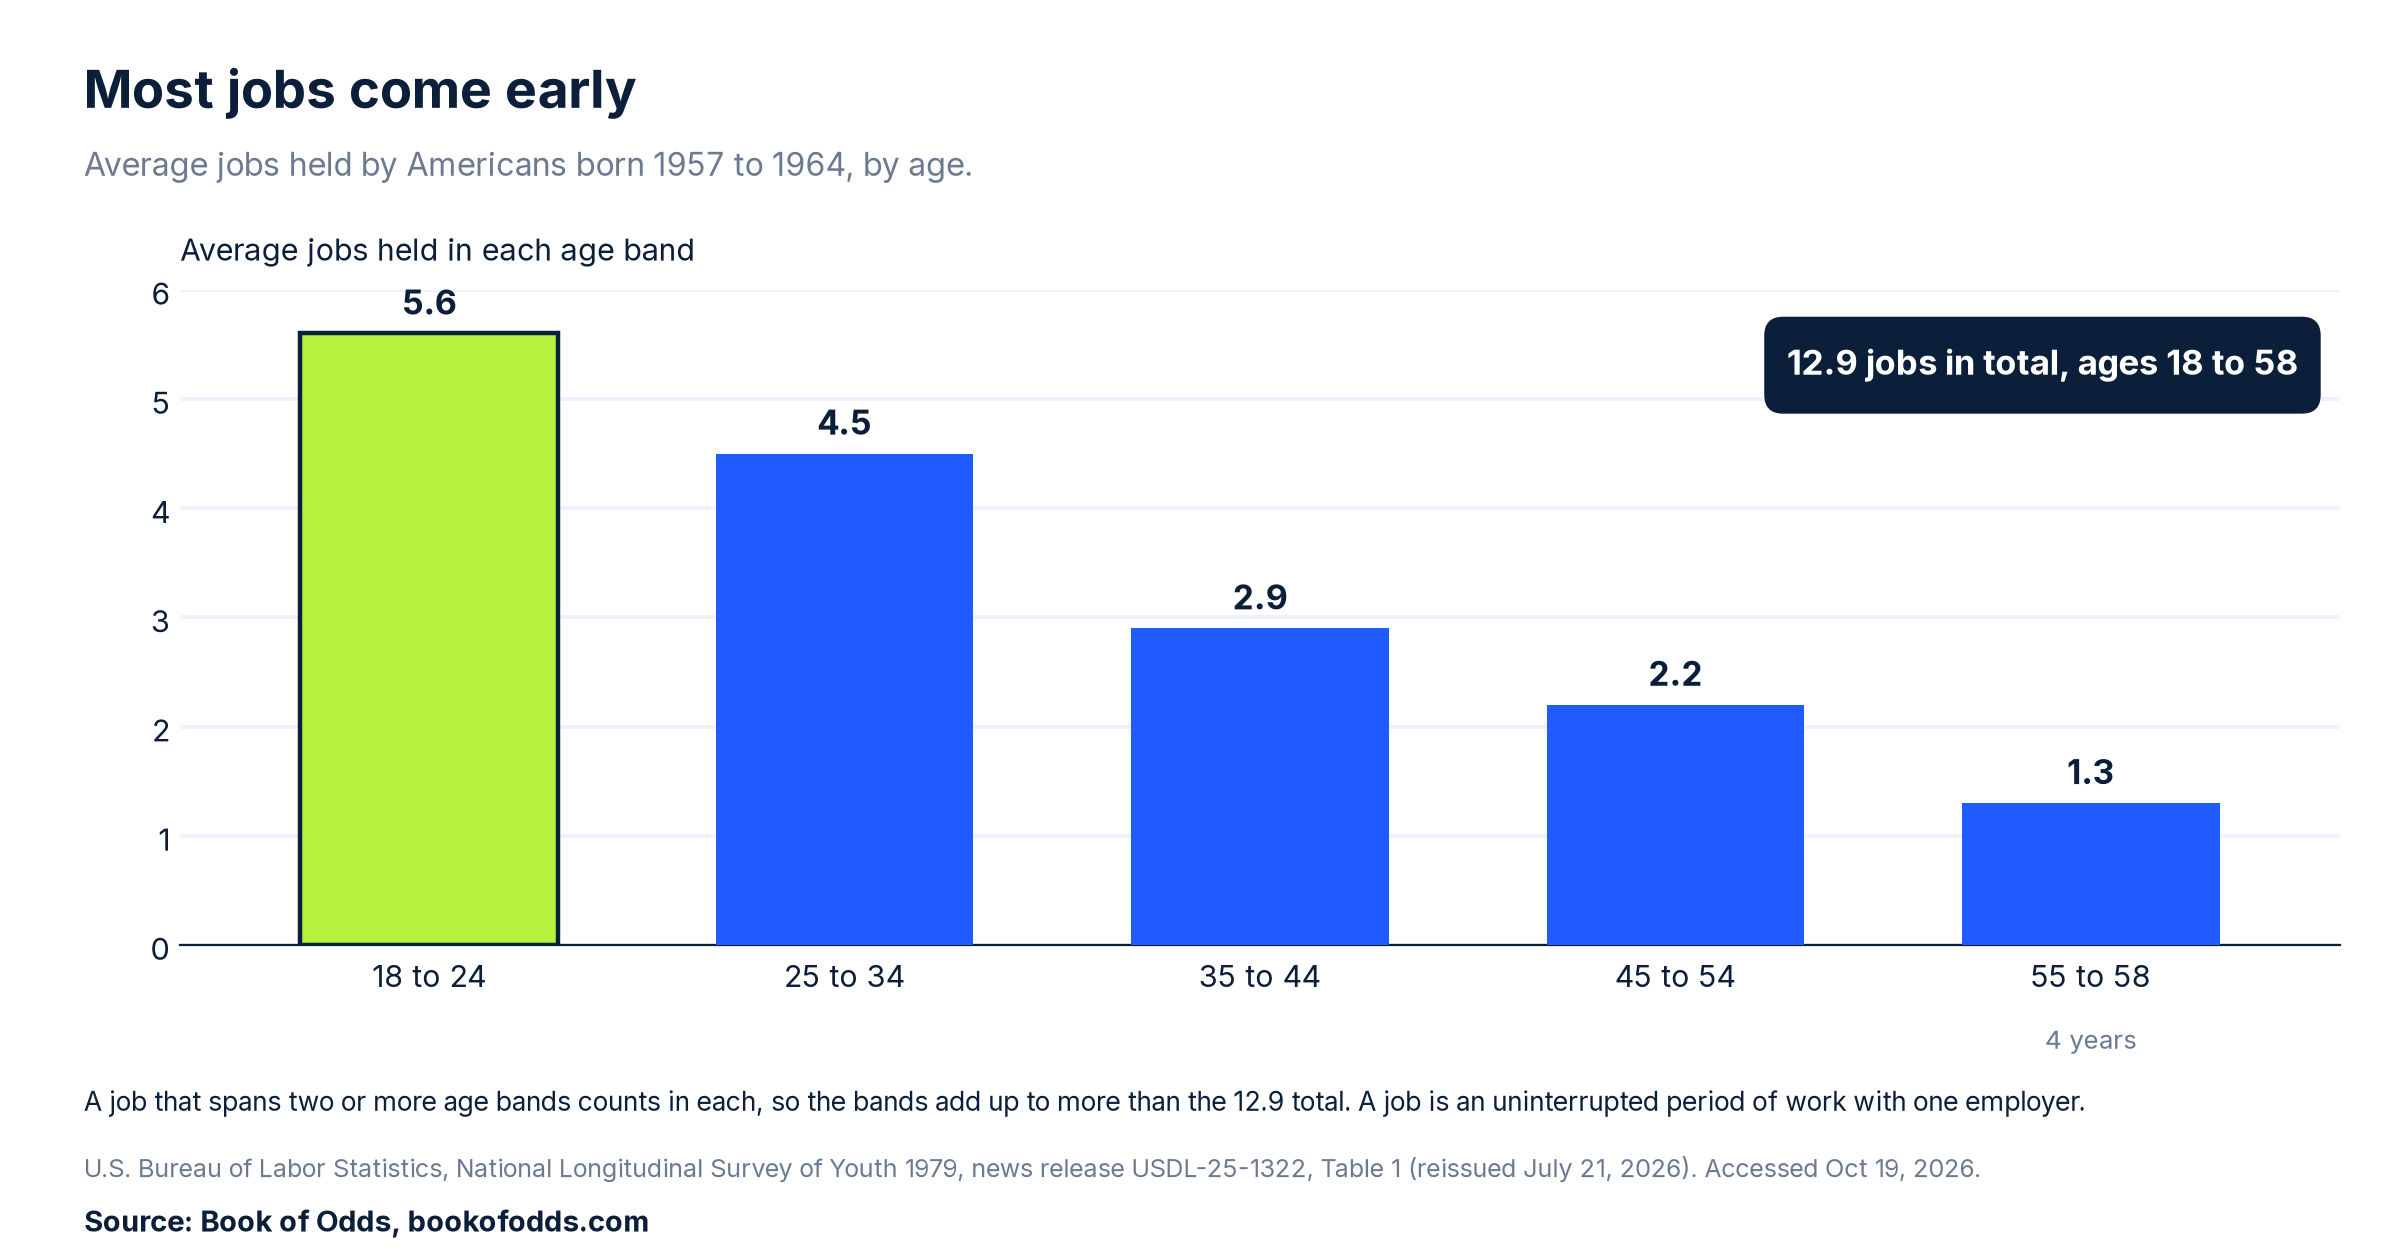
After that the count falls with each age band: 4.5 jobs from 25 to 34, 2.9 from 35 to 44, 2.2 from 45 to 54 and 1.3 in the four years from 55 to 58. A job that runs across two or more age bands is counted once in each, so the bands add up to more than 12.9. Adding them is a fine way to invent extra jobs.
Early jobs were also short. Of the jobs these workers began at ages 18 to 24, the average worker had 61 percent of those jobs end in less than a year. For jobs begun at 45 to 54, that share was 21 percent.
Education cuts both ways
By education, the pattern runs in opposite directions for men and women. Men without a high school diploma held 14.3 jobs from 18 to 58, and men with a bachelor’s degree or higher held 12.4. For women it goes the other way: 10.7 jobs without a diploma and 13.6 with a bachelor’s degree or higher. Education is as of the 2022 to 23 interview, and the survey records the counts, not the reasons.
The career myth
Search for how many careers a person has and numbers turn up. BLS, which runs the survey behind the jobs count, says this:
“The Bureau of Labor Statistics (BLS) never has attempted to estimate the number of times people change careers in the course of their working lives. The reason we have not produced such estimates is that no consensus has emerged on what constitutes a career change.”
So any figure for how many careers people have is not from BLS. What BLS counts is jobs held, one for each stretch of work with an employer. What counts as a career, it says, is a question with no agreed answer yet.
A younger group, counted differently
BLS also follows people born from 1980 to 1984, in the National Longitudinal Survey of Youth 1997. They held an average of 9.4 jobs from age 18 through 38: 9.2 for men and 9.5 for women.
That figure sits in its own section for two reasons. Its span stops at 38, 20 years short of the older group’s 58. And the two surveys count a return to the same employer differently: in the 1997 survey, someone who leaves a job and later returns to the same job is not counted as holding a new job, while the 1979 survey counts it as new. So the two numbers are not directly comparable (our inference).
One more number, from a different survey and measuring something else: BLS’s Current Population Survey of all wage and salary workers found that the median worker had been with their current employer 4.1 years in January 2026. That is time with one employer, not jobs held, so it does not line up with either count above.
Data limits
These are counts of jobs held, not career changes or job changes. The 12.9 covers one group of people, born from 1957 to 1964 and living in the United States in 1979; people of that age who moved to the US after 1979 are not represented. The count stops at 58 because, in BLS’s words, “the sample sizes were still too small to provide statistically reliable estimates for age groups older than 58,” so it is not a whole working life. The 9.4 covers a different group, a shorter span and a different rule for returns to an employer.
The short version
Americans born from 1957 to 1964 held an average of 12.9 jobs from ages 18 to 58, per the Bureau of Labor Statistics, and over 40 percent of them were held from 18 to 24. BLS counts jobs held and has never estimated career changes. New data for this group are due in late 2026 or early 2027, and this page will be rechecked then.
Last checked: 2026-10-19, against the Bureau of Labor Statistics’ National Longitudinal Survey of Youth releases for people born 1957 to 1964 and 1980 to 1984, the BLS NLS FAQs and the BLS employee tenure release for 2026. This article was machine-checked against the sources above and has not been expert-reviewed. Spotted an error or a newer public figure? Please tell us on our contact page with the article link and we will review it.
Sources
- S1 U.S. Bureau of Labor Statistics, “Number of Jobs, Labor Market Experience, Marital Status, and Health for those Born 1957-1964,” news release USDL-25-1322, Aug. 26, 2025, reissued July 21, 2026, with Table 1 and Technical Note. https://www.bls.gov/news.release/nlsoy.nr0.htm ; https://www.bls.gov/news.release/nlsoy.t01.htm ; https://www.bls.gov/news.release/nlsoy.tn.htm . Accessed Oct 19, 2026.
- S2 U.S. Bureau of Labor Statistics, “Labor Market Experience, Education, Partner Status, and Health for those Born 1980-1984,” news release USDL-26-0684, May 5, 2026, reissued July 17, 2026, with Table 1 and Technical Note. https://www.bls.gov/news.release/nlsyth.nr0.htm ; https://www.bls.gov/news.release/nlsyth.t01.htm ; https://www.bls.gov/news.release/nlsyth.tn.htm . Accessed Oct 19, 2026.
- S3 U.S. Bureau of Labor Statistics, National Longitudinal Surveys, “NLS FAQs” (questions and answers), last modified March 31, 2025. https://www.bls.gov/nls/questions-and-answers.htm . Accessed Oct 19, 2026.
- S4 U.S. Bureau of Labor Statistics, “Employee Tenure in 2026,” news release USDL-26-1532, Sept. 24, 2026. https://www.bls.gov/news.release/tenure.nr0.htm . Accessed Oct 19, 2026.
- Method: all figures are as published by BLS, except two pieces of our arithmetic: 12.9 rounded to about 13, and the 20 years between the two age spans (58 minus 38). We did not add the age bands or compare the two groups’ job counts. Table 1 of S1 is the source of the chart.