
Powerball Strategies: What Actually Changes Your Odds

Picking methods don't change the 1 in 292.2 million jackpot odds of a $2 Powerball play; twice the different combinations doubles your chance and your cost, and a ticket returns well under $2 on average.

Illustration of one white ball in front of an endless field of identical blank white balls reaching the horizon.

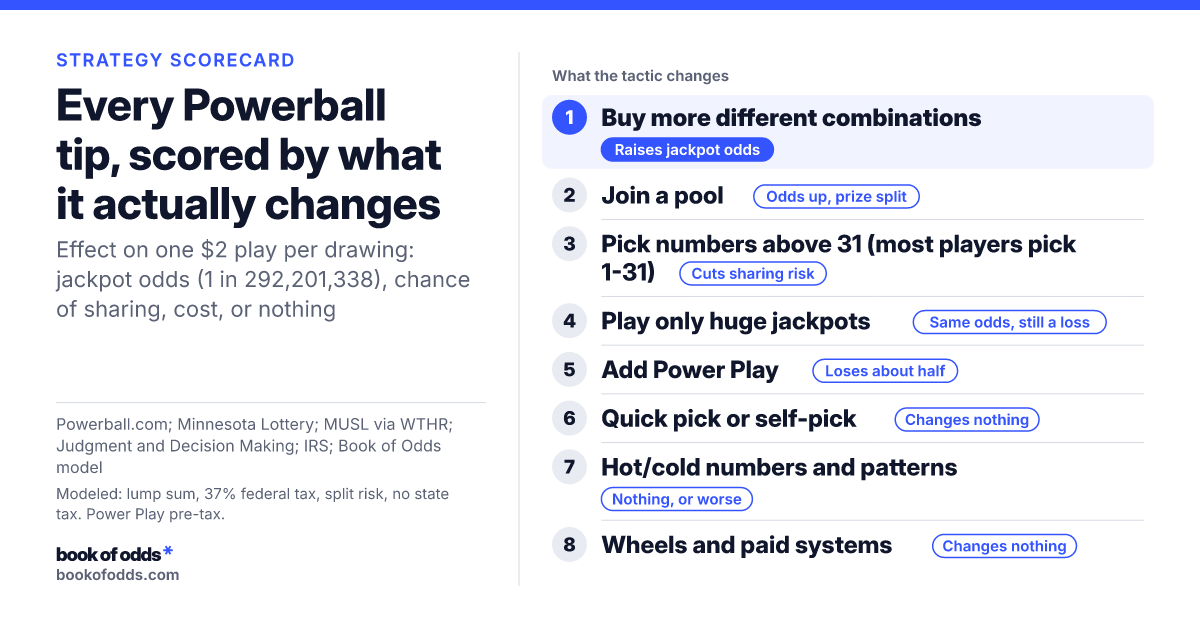
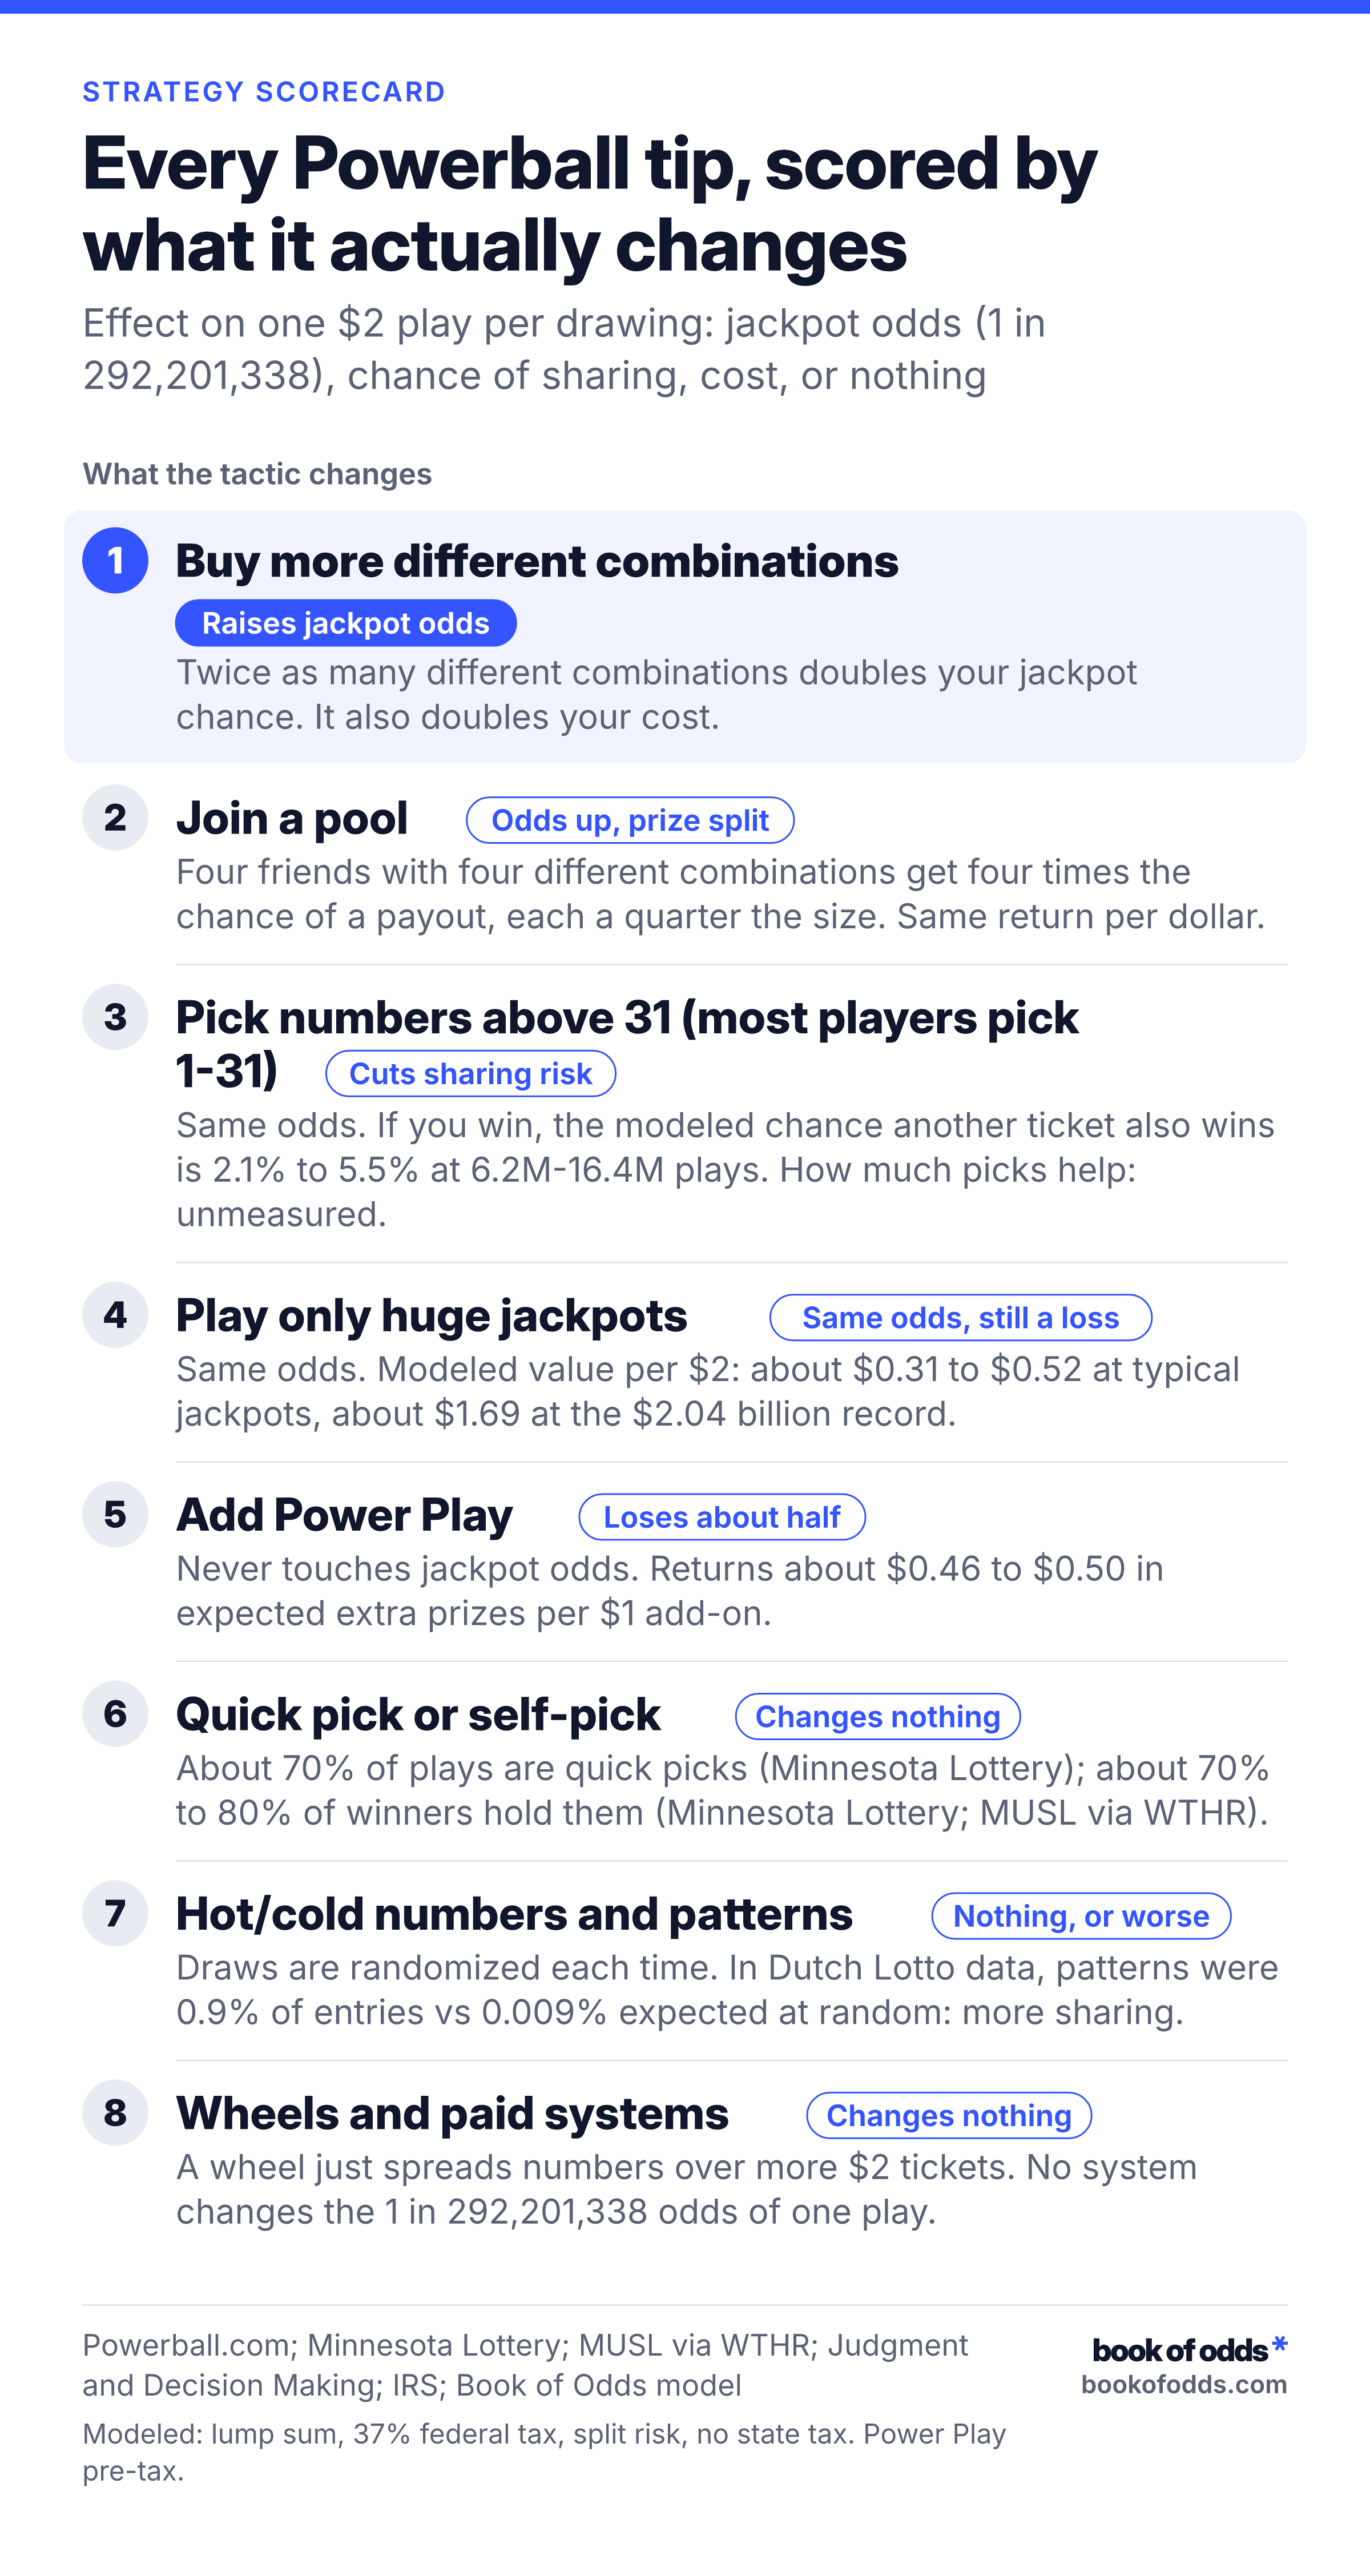
STRATEGY SCORECARD

Every Powerball tip, scored by what it actually changes

Effect on one $2 play per drawing: jackpot odds (1 in 292,201,338), chance of sharing, cost, or nothing

What the tactic changes

  1. Buy more different combinations, highlighted Raises jackpot odds Twice as many different combinations doubles your jackpot chance. It also doubles your cost.
  2. Join a pool Odds up, prize split Four friends with four different combinations get four times the chance of a payout, each a quarter the size. Same return per dollar.
  3. Pick numbers above 31 (most players pick 1-31) Cuts sharing risk Same odds. If you win, the modeled chance another ticket also wins is 2.1% to 5.5% at 6.2M-16.4M plays. How much picks help: unmeasured.
  4. Play only huge jackpots Same odds, still a loss Same odds. Modeled value per $2: about $0.31 to $0.52 at typical jackpots, about $1.69 at the $2.04 billion record.
  5. Add Power Play Loses about half Never touches jackpot odds. Returns about $0.46 to $0.50 in expected extra prizes per $1 add-on.
  6. Quick pick or self-pick Changes nothing About 70% of plays are quick picks (Minnesota Lottery); about 70% to 80% of winners hold them (Minnesota Lottery; MUSL via WTHR).
  7. Hot/cold numbers and patterns Nothing, or worse Draws are randomized each time. In Dutch Lotto data, patterns were 0.9% of entries vs 0.009% expected at random: more sharing.
  8. Wheels and paid systems Changes nothing A wheel just spreads numbers over more $2 tickets. No system changes the 1 in 292,201,338 odds of one play.

Powerball.com; Minnesota Lottery; MUSL via WTHR; Judgment and Decision Making; IRS; Book of Odds model

Modeled: lump sum, 37% federal tax, split risk, no state tax. Power Play pre-tax.

Last checked · Suggest a correction

No Powerball strategy changes the odds of a single $2 play. It is 1 in 292,201,338 per drawing whether you use quick pick, birthdays or a paid system. Buy twice as many different number combinations and you double your chance of winning the jackpot. You also double your cost. If you play, set a budget you can lose, pick numbers above 31 if you pick at all (it cuts the chance of sharing, not the odds), and treat Power Play as an add-on that returns about half its $1 price.

Where the odds come from

Odds per $2 Powerball play of each prize tier in one drawing (1 in N), plus the odds of any prize. Jackpot: 5 white balls + Powerball: 292,201,338 1 in N per $2 play; Match 5: $1,000,000: 11,688,054 1 in N per $2 play; Match 4 + Powerball: $50,000: 913,129 1 in N per $2 play; Match 4: $100: 36,525 1 in N per $2 play; Match 3 + Powerball: $100: 14,494 1 in N per $2 play; Match 3: $7: 579.8 1 in N per $2 play; Match 2 + Powerball: $7: 701.3 1 in N per $2 play; Match 1 + Powerball: $4: 91.98 1 in N per $2 play; Powerball only: $4: 38.32 1 in N per $2 play; Any prize: 24.87 1 in N per $2 play (highlighted). Per draw, One $2 Powerball play. Source: Multi-State Lottery Association (Powerball.com), data year 2026.BOOK OF ODDSOdds per $2 Powerball play of each prize tier inone drawing (1 in N), plus the odds of any prizeper draw · One $2 Powerball playJackpot: 5 white balls + Powerball292,201,338 1 in N per $2 playMatch 5: $1,000,00011,688,054 1 in N per $2 playMatch 4 + Powerball: $50,000913,129 1 in N per $2 playMatch 4: $10036,525 1 in N per $2 playMatch 3 + Powerball: $10014,494 1 in N per $2 playMatch 3: $7579.8 1 in N per $2 playMatch 2 + Powerball: $7701.3 1 in N per $2 playMatch 1 + Powerball: $491.98 1 in N per $2 playPowerball only: $438.32 1 in N per $2 play▶ Any prize24.87 1 in N per $2 playSource: Multi-State Lottery Association (Powerball.com) · Data year 2026
Odds per $2 Powerball play of each prize tier in one drawing (1 in N), plus the odds of any prize. Jackpot: 5 white balls + Powerball: 292,201,338 1 in N per $2 play; Match 5: $1,000,000: 11,688,054 1 in N per $2 play; Match 4 + Powerball: $50,000: 913,129 1 in N per $2 play; Match 4: $100: 36,525 1 in N per $2 play; Match 3 + Powerball: $100: 14,494 1 in N per $2 play; Match 3: $7: 579.8 1 in N per $2 play; Match 2 + Powerball: $7: 701.3 1 in N per $2 play; Match 1 + Powerball: $4: 91.98 1 in N per $2 play; Powerball only: $4: 38.32 1 in N per $2 play; Any prize: 24.87 1 in N per $2 play (highlighted). Per draw, One $2 Powerball play. Source: Multi-State Lottery Association (Powerball.com), data year 2026.BOOK OF ODDSOdds per $2 Powerball playof each prize tier in onedrawing (1 in N), plus theodds of any prizeper draw · One $2 Powerball playJackpot: 5 whiteballs + Powerball292,201,338 1 in N per $2 playMatch 5: $1,000,00011,688,054 1 in N per $2 playMatch 4 +Powerball: $50,000913,129 1 in N per $2 playMatch 4: $10036,525 1 in N per $2 playMatch 3 +Powerball: $10014,494 1 in N per $2 playMatch 3: $7579.8 1 in N per $2 playMatch 2 +Powerball: $7701.3 1 in N per $2 playMatch 1 +Powerball: $491.98 1 in N per $2 playPowerball only: $438.32 1 in N per $2 play▶ Any prize24.87 1 in N per $2 playSource: Multi-State Lottery Association(Powerball.com) · Data year 2026
Multi-State Lottery Association (Powerball.com) · Data year 2026
View the data table
Outcome
Jackpot: 5 white balls + Powerball292,201,338
Match 5: $1,000,00011,688,053.5200
Match 4 + Powerball: $50,000913,129.1800
Match 4: $10036,525.1700
Match 3 + Powerball: $10014,494.1100
Match 3: $7579.7600
Match 2 + Powerball: $7701.3300
Match 1 + Powerball: $491.9800
Powerball only: $438.3200
Any prize24.8700

Powerball.com lays out the game. You choose five white balls from 1 to 69 and one red Powerball from 1 to 26, and each play costs $2. The order of the white balls does not matter.

Now count the tickets that could exist. There are 11,238,513 ways to choose five white balls from 69. Multiply by 26 possible Powerballs and you get 292,201,338 combinations. Your play holds one of them, so your chance of the jackpot in one drawing is 1 in 292,201,338, or about 1 in 292.2 million.

Drawings happen three times a week, Monday, Wednesday and Saturday at 10:59 pm ET, at the Florida Lottery draw studio in Tallahassee. The Monday drawing began August 23, 2021. Tickets are sold in 45 states, the District of Columbia, Puerto Rico and the U.S. Virgin Islands.

The jackpot is one of nine prize tiers. Your chance of winning any prize at all is 1 in 24.87 per play, and most of those wins are $4 prizes: the Powerball alone (1 in 38.32) or one white ball plus the Powerball (1 in 91.98). Lower-tier prizes are fixed cash amounts everywhere except California.

The game got harder in October 2015, when Powerball moved from 5 of 59 white balls plus 1 of 35 red to today’s 5 of 69 plus 1 of 26, according to the North Carolina Education Lottery. Overall prize odds improved from 1 in 32 to 1 in 25, but jackpot odds lengthened from about 1 in 175 million to about 1 in 292 million. Older figures you may see, such as 1 in 195,249,054, describe an older 5/59 + 1/39 version of the game. For the same kind of arithmetic on other games, see our page on the odds of winning a jackpot.

Every popular strategy, scored

The scorecard at the top of this page sorts every common tip by what it actually changes: your jackpot odds, your chance of sharing, your cost, or nothing. Here are the full verdicts for the tips that end here.

Quick pick versus your own numbers. A quick pick is a ticket the terminal fills with random numbers. The Minnesota Lottery’s Lotto Games FAQ says about 70 percent of plays are quick picks and about 70 percent of winners hold them. The Multi-State Lottery Association, quoted by WTHR in 2022, put quick picks at roughly 80% of jackpot-winning tickets. Either way, quick picks win in about the same share as they are bought. Neither method wins more often for its use.

Hot and cold numbers. A hot number has come up often lately; a cold one hasn’t. Powerball uses physical machines and ball sets chosen at random from a sealed vault before each drawing. Balls are weighed, machines are tested, and the drawing is recorded under the observation of an independent accounting firm. The machine has no memory of last Saturday. One honest limit: this verdict rests on how the draw is run. We have not run a statistical test on past results.

Odd/even balance and patterns. Every combination is equally likely, so a balanced mix of odd and even numbers has the same 1 in 292,201,338 chance as any other ticket. Patterns are worse than neutral. In peer-reviewed research on millions of lottery entries, diagonal and vertical patterns on the play slip showed up in 0.9% of combinations, against 0.009% expected at random. If a pattern ever hits, you are more likely than other winners to have company.

Wheels and paid systems. A wheel is a scheme for spreading a set of favorite numbers across many tickets. It buys more combinations at $2 each and does nothing else. Software and systems sold online either work the same way or do nothing at all, because no method changes the odds of a single play.

Five tips get their own sections below because they change something real: buying more tickets and joining a pool (your odds and your cost), picking unpopular numbers (your chance of sharing), playing only big jackpots (your expected value) and Power Play (your cost).

More tickets and pools: how fast the odds grow

Modeled chance per player of at least one Powerball jackpot over 10-50 years of all 156 drawings a year (distinct combinations, independent drawings). 1 ticket per drawing, 10 years: 0.00053 % chance per player (modeled); 1 ticket per drawing, 30 years: 0.0016 % chance per player (modeled); 1 ticket per drawing, 50 years: 0.0027 % chance per player (modeled); 5 tickets per drawing, 10 years: 0.0027 % chance per player (modeled); 5 tickets per drawing, 30 years: 0.008 % chance per player (modeled); 5 tickets per drawing, 50 years: 0.013 % chance per player (modeled); 20 tickets per drawing, 10 years: 0.011 % chance per player (modeled); 20 tickets per drawing, 30 years: 0.032 % chance per player (modeled); 20 tickets per drawing, 50 years: 0.053 % chance per player (modeled) (highlighted). Mathematical model; assumptions: Every combination of five white balls from 1-69 and one Powerball from 1-26 is equally likely, and drawings are independent. No number choice, pattern, history or system changes the odds of any single play; only buying more distinct combinations raises jackpot probability. Multiple tickets in one drawing are assumed to be distinct combinations.BOOK OF ODDSModeled chance per player of at least onePowerball jackpot over 10-50 years of all 156drawings a year (distinct combinations,independent drawings)1 ticket per drawing, 10 years0.00053 % chance per player (modeled)1 ticket per drawing, 30 years0.0016 % chance per player (modeled)1 ticket per drawing, 50 years0.0027 % chance per player (modeled)5 tickets per drawing, 10 years0.0027 % chance per player (modeled)5 tickets per drawing, 30 years0.008 % chance per player (modeled)5 tickets per drawing, 50 years0.013 % chance per player (modeled)20 tickets per drawing, 10 years0.011 % chance per player (modeled)20 tickets per drawing, 30 years0.032 % chance per player (modeled)▶ 20 tickets per drawing, 50years0.053 % chance per player (modeled)0 to 0.053 % chance per player (modeled) · zero baseline · ▶ = highlightedMathematical model · Every combination of five white balls from 1-69 and one Powerball from1-26 is equally likely, and drawings are independent. No number choice, pattern, history orsystem changes the odds of any single play; only buying more distinct combinations raisesjackpot probability. Multiple tickets in one drawing are assumed to be distinct combinations.
Modeled chance per player of at least one Powerball jackpot over 10-50 years of all 156 drawings a year (distinct combinations, independent drawings). 1 ticket per drawing, 10 years: 0.00053 % chance per player (modeled); 1 ticket per drawing, 30 years: 0.0016 % chance per player (modeled); 1 ticket per drawing, 50 years: 0.0027 % chance per player (modeled); 5 tickets per drawing, 10 years: 0.0027 % chance per player (modeled); 5 tickets per drawing, 30 years: 0.008 % chance per player (modeled); 5 tickets per drawing, 50 years: 0.013 % chance per player (modeled); 20 tickets per drawing, 10 years: 0.011 % chance per player (modeled); 20 tickets per drawing, 30 years: 0.032 % chance per player (modeled); 20 tickets per drawing, 50 years: 0.053 % chance per player (modeled) (highlighted). Mathematical model; assumptions: Every combination of five white balls from 1-69 and one Powerball from 1-26 is equally likely, and drawings are independent. No number choice, pattern, history or system changes the odds of any single play; only buying more distinct combinations raises jackpot probability. Multiple tickets in one drawing are assumed to be distinct combinations.BOOK OF ODDSModeled chance per playerof at least one Powerballjackpot over 10-50 years ofall 156 drawings a year(distinct combinations,independent drawings)1 ticket per drawing, 10 years0.00053 % chance per player (modeled)1 ticket per drawing, 30 years0.0016 % chance per player (modeled)1 ticket per drawing, 50 years0.0027 % chance per player (modeled)5 tickets per drawing, 10 years0.0027 % chance per player (modeled)5 tickets per drawing, 30 years0.008 % chance per player (modeled)5 tickets per drawing, 50 years0.013 % chance per player (modeled)20 tickets per drawing, 10 years0.011 % chance per player (modeled)20 tickets per drawing, 30 years0.032 % chance per player (modeled)▶ 20 tickets per drawing, 50 years0.053 % chance per player (modeled)0 to 0.053 % chance per player (modeled) · zerobaseline · ▶ = highlightedMathematical model · Every combination of fivewhite balls from 1-69 and one Powerball from 1-26is equally likely, and drawings are independent. Nonumber choice, pattern, history or system changesthe odds of any single play; only buying moredistinct combinations raises jackpot probability.Multiple tickets in one drawing are assumed to bedistinct combinations.
Mathematical model · Every combination of five white balls from 1-69 and one Powerball from 1-26 is equally likely, and drawings are independent. No number choice, pattern, history or system changes the odds of any single play; only buying more distinct combinations raises jackpot probability. Multiple tickets in one drawing are assumed to be distinct combinations.
View the data table
Outcome
1 ticket per drawing, 10 years0.00053
1 ticket per drawing, 30 years0.0016
1 ticket per drawing, 50 years0.0027
5 tickets per drawing, 10 years0.0027
5 tickets per drawing, 30 years0.008
5 tickets per drawing, 50 years0.0130
20 tickets per drawing, 10 years0.0110
20 tickets per drawing, 30 years0.0320
20 tickets per drawing, 50 years0.0530

Buy twice as many different number combinations and you double your chance of winning the jackpot. You also double your cost. One combination gives you a 1 in 292,201,338 chance per drawing. Two different combinations give you two chances: your probability doubles, and so does your spending. The combinations must differ, since a second copy of the same numbers adds no chance. Twenty different combinations in one drawing get you to about 1 in 14.6 million, at 20 times the price.

Now stretch that over decades. Say you buy tickets for every drawing, all 156 a year. Your chance, as one player, of at least one jackpot works out to:

  • 1 ticket per drawing: about 0.00053% after 10 years, 0.0016% after 30 and 0.0027% after 50.
  • 5 tickets per drawing: about 0.0027%, 0.008% and 0.013%.
  • 20 tickets per drawing: about 0.011%, 0.032% and 0.053%.

So 20 tickets every drawing for 50 years gives you about a 0.053% chance of ever hitting. That is a cumulative probability: the chance across all those drawings combined, for one player, not a rate for the whole population. These figures are modeled from the game’s odds and assume each of your tickets in a drawing is a different combination and that drawings are independent.

Pools follow the same math. Say four friends each chip in for one ticket and pick four different combinations. The group has four times the chance of one ticket, so your chance of collecting something rises fourfold. But each of you owns a quarter of any prize, so whatever you collect is a quarter of the win. With equal stakes and different combinations, your expected return per dollar matches playing alone. What changes is the shape: more chances to collect, smaller amounts when you do. Joining a pool gives up the slim chance of keeping the whole prize in exchange for a bigger chance of a smaller share. Join one if you like the company and accept splitting every prize, from $4 up.

Unpopular numbers and the risk of sharing

If your ticket wins: modeled chance another ticket also wins, by plays sold. About 6.2 million plays: 2.1 % chance; About 16.4 million plays: 5.5 % chance; 100 million plays (model level): 29 % chance; About 275 million plays (record): 61 % chance (highlighted). Mathematical model; assumptions: Every combination of five white balls from 1-69 and one Powerball from 1-26 is equally likely, and drawings are independent. No number choice, pattern, history or system changes the odds of any single play; only buying more distinct combinations raises jackpot probability. Multiple tickets in one drawing are assumed to be distinct combinations.BOOK OF ODDSIf your ticket wins: modeled chance anotherticket also wins, by plays soldAbout 6.2 million plays2.1 % chanceAbout 16.4 million plays5.5 % chance100 million plays (modellevel)29 % chance▶ About 275 million plays(record)61 % chance0 to 61 % chance · zero baseline · ▶ = highlightedMathematical model · Every combination of five white balls from 1-69 and one Powerball from1-26 is equally likely, and drawings are independent. No number choice, pattern, history orsystem changes the odds of any single play; only buying more distinct combinations raisesjackpot probability. Multiple tickets in one drawing are assumed to be distinct combinations.
If your ticket wins: modeled chance another ticket also wins, by plays sold. About 6.2 million plays: 2.1 % chance; About 16.4 million plays: 5.5 % chance; 100 million plays (model level): 29 % chance; About 275 million plays (record): 61 % chance (highlighted). Mathematical model; assumptions: Every combination of five white balls from 1-69 and one Powerball from 1-26 is equally likely, and drawings are independent. No number choice, pattern, history or system changes the odds of any single play; only buying more distinct combinations raises jackpot probability. Multiple tickets in one drawing are assumed to be distinct combinations.BOOK OF ODDSIf your ticket wins: modeledchance another ticket alsowins, by plays soldAbout 6.2 million plays2.1 % chanceAbout 16.4 million plays5.5 % chance100 million plays (model level)29 % chance▶ About 275 million plays (record)61 % chance0 to 61 % chance · zero baseline · ▶ = highlightedMathematical model · Every combination of fivewhite balls from 1-69 and one Powerball from 1-26is equally likely, and drawings are independent. Nonumber choice, pattern, history or system changesthe odds of any single play; only buying moredistinct combinations raises jackpot probability.Multiple tickets in one drawing are assumed to bedistinct combinations.
Mathematical model · Every combination of five white balls from 1-69 and one Powerball from 1-26 is equally likely, and drawings are independent. No number choice, pattern, history or system changes the odds of any single play; only buying more distinct combinations raises jackpot probability. Multiple tickets in one drawing are assumed to be distinct combinations.
View the data table
Outcome
About 6.2 million plays2.1000
About 16.4 million plays5.5000
100 million plays (model level)29
About 275 million plays (record)61

Picking numbers other people avoid does not make you more likely to win. It makes you less likely to share if you do. A Rutgers University statistician made that point in 2022: unpopular numbers reduce sharing, while the chance of winning stays the same.

People are not random pickers. A 2016 study in the journal Judgment and Decision Making analyzed 5.1 million combinations from the Dutch Lotto and found numbers 1 to 31 over-picked, especially 1 to 12. Those are the numbers on a calendar. The same study found the patterns mentioned above far more often than chance. The data come from a Dutch game, not Powerball, but the habit is the point: if you pick, numbers above 31 put you in a less crowded part of the ticket.

How much does sharing matter? The question that counts is this one: if your ticket wins, how likely is it that another ticket also wins? That depends on how many other plays were sold. We used a Poisson model, a standard formula for how often rare random events happen when there are many independent chances, and treated every play as a random pick. If your ticket wins, the modeled chance that at least one other ticket also wins is:

  • About 6.2 million plays (a typical $20 million jackpot drawing in January 2025): about 2.1%.
  • About 16.4 million plays (a $263 million jackpot drawing that month): about 5.5%.
  • 100 million plays (a modeling level, not a recorded drawing): about 29%.
  • About 275 million plays (the record $2.04 billion drawing on Nov. 7, 2022): about 61%.

So in a typical drawing, a winner almost always keeps the whole jackpot, and avoiding popular numbers has little to work with. At record sales, a winner more likely than not shares it, and that is where avoiding popular numbers could pay off.

You may see a smaller figure for the same drawings: the chance that a drawing ends with two or more winning tickets, about 0.022% at 6.2 million plays and 24.3% at 275 million. That describes the drawing, not your ticket, so it understates what a winner faces.

Three limits apply. The typical sales figures come from a hobbyist sales tracker, The Lotto Report, and the record play count is inferred from Powerball.com’s count of prize-winning tickets, so it is an estimate of about 270 million to 280 million plays. The model treats every pick as random, so it gives the same answer for every ticket and cannot show how much unpopular numbers help. Real players cluster on popular numbers, so a winner holding popular numbers shares more often than shown, and one holding unpopular numbers less often. Our evidence contains no Powerball-specific measurement of that difference. The direction is settled; the size is unresolved.

Could you just buy every combination?

BUY THEM ALL

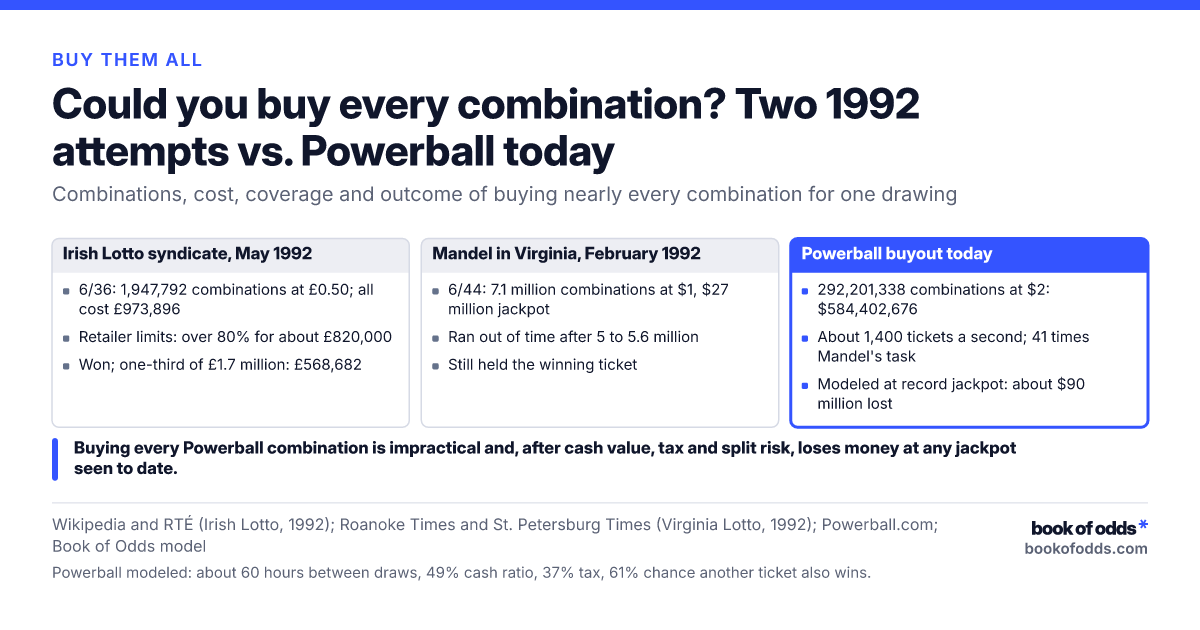
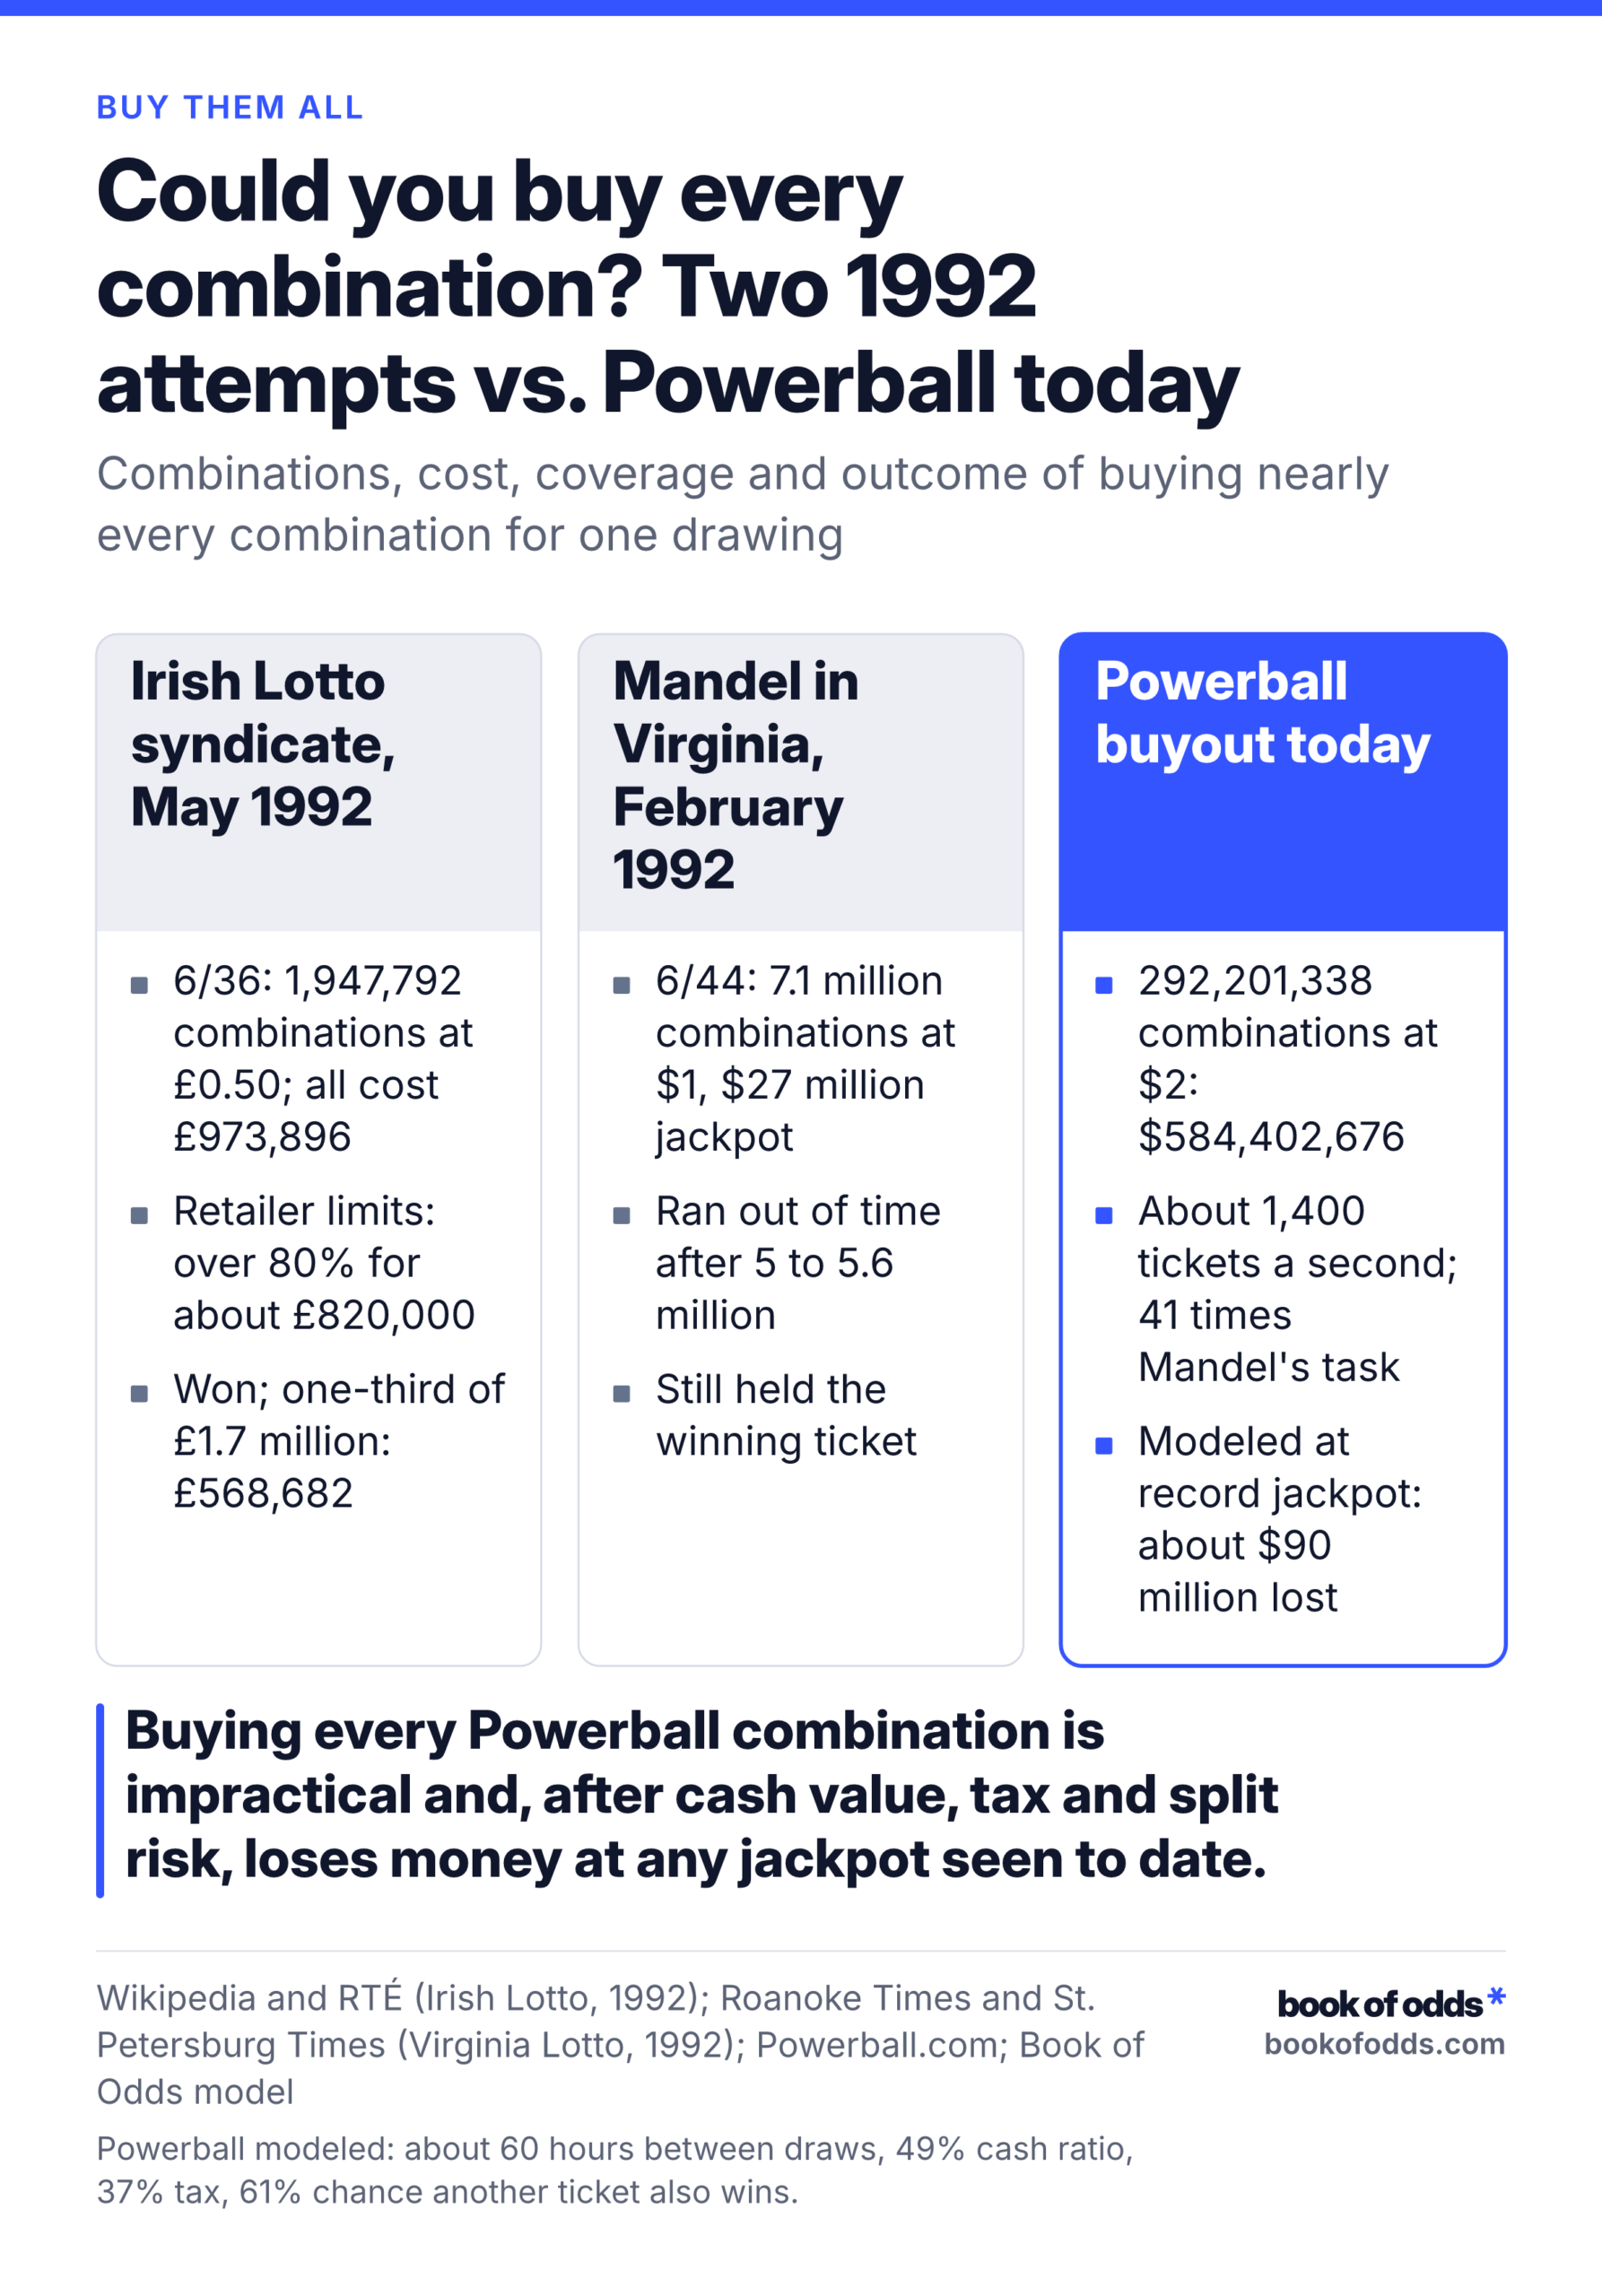
Could you buy every combination? Two 1992 attempts vs. Powerball today

Combinations, cost, coverage and outcome of buying nearly every combination for one drawing

Irish Lotto syndicate, May 1992

  • 6/36: 1,947,792 combinations at £0.50; all cost £973,896
  • Retailer limits: over 80% for about £820,000
  • Won; one-third of £1.7 million: £568,682

Mandel in Virginia, February 1992

  • 6/44: 7.1 million combinations at $1, $27 million jackpot
  • Ran out of time after 5 to 5.6 million
  • Still held the winning ticket

Powerball buyout today

  • 292,201,338 combinations at $2: $584,402,676
  • About 1,400 tickets a second; 41 times Mandel's task
  • Modeled at record jackpot: about $90 million lost

Buying every Powerball combination is impractical and, after cash value, tax and split risk, loses money at any jackpot seen to date.

Wikipedia and RTÉ (Irish Lotto, 1992); Roanoke Times and St. Petersburg Times (Virginia Lotto, 1992); Powerball.com; Book of Odds model

Powerball modeled: about 60 hours between draws, 49% cash ratio, 37% tax, 61% chance another ticket also wins.
If one of the combinations must win, why not buy them all? Two syndicates tried versions of this in 1992.

In May 1992 Stefan Klincewicz’s syndicate went after the Irish 6/36 Lotto. It had 1,947,792 combinations at £0.50 each, so all of them cost £973,896. Retailer limits stopped full coverage, but the group bought over 80% of the combinations for an estimated £820,000 and held the winning numbers. The £1.7 million jackpot was shared three ways, so the syndicate took one-third, £568,682, plus smaller prizes. From August 1992 the Irish Lotto moved to a 6/39 game with jackpot odds of 1 in 3,262,623.

In February 1992 Stefan Mandel’s International Lotto Fund tried to buy all 7.1 million combinations of Virginia’s 6/44 Lotto at $1 each, chasing a $27 million jackpot. It ran out of time after 5 million to 5.6 million tickets but still held the winning ticket.

Powerball is a different animal. Every combination for one drawing costs $584,402,676. That means about 292 million tickets printed in the 2 to 3 days between drawings, roughly 1,400 tickets a second, and 41 times the combinations Mandel could not finish. Then comes the payout: the cash value at the record was about 49% of the advertised jackpot, the top federal tax rate is 37%, and at record sales our model expects a winning ticket to keep only about 0.653 of the jackpot once splits are counted. Even counting about $93.5 million in expected lower-tier prizes, our model puts a full buyout at the record jackpot at an expected loss of about $90 million. It loses money at any jackpot seen to date.

Is a ticket, or Power Play, ever worth it?

Modeled expected value of one $2 Powerball ticket by advertised jackpot, after lump sum, 37% federal tax and split risk. $20 million jackpot: 0.31 dollars per $2 ticket; $100 million jackpot (modeled sales level, not a recorded drawing): 0.38 dollars per $2 ticket; $263 million jackpot: 0.52 dollars per $2 ticket; $2.04 billion record: 1.69 dollars per $2 ticket (highlighted); Record, if no one could share it (not real): 2.44 dollars per $2 ticket; Ticket price: 2 dollars per $2 ticket. Mathematical model; assumptions: Every combination of five white balls from 1-69 and one Powerball from 1-26 is equally likely, and drawings are independent. No number choice, pattern, history or system changes the odds of any single play; only buying more distinct combinations raises jackpot probability. Multiple tickets in one drawing are assumed to be distinct combinations.BOOK OF ODDSModeled expected value of one $2 Powerballticket by advertised jackpot, after lump sum,37% federal tax and split risk$20 million jackpot0.31 dollars per $2 ticket$100 million jackpot(modeled sales level, not arecorded drawing)0.38 dollars per $2 ticket$263 million jackpot0.52 dollars per $2 ticket▶ $2.04 billion record1.69 dollars per $2 ticketRecord, if no one could shareit (not real)2.44 dollars per $2 ticketTicket price2 dollars per $2 ticket0 to 2.44 dollars per $2 ticket · zero baseline · ▶ = highlightedMathematical model · Every combination of five white balls from 1-69 and one Powerball from1-26 is equally likely, and drawings are independent. No number choice, pattern, history orsystem changes the odds of any single play; only buying more distinct combinations raisesjackpot probability. Multiple tickets in one drawing are assumed to be distinct combinations.
Modeled expected value of one $2 Powerball ticket by advertised jackpot, after lump sum, 37% federal tax and split risk. $20 million jackpot: 0.31 dollars per $2 ticket; $100 million jackpot (modeled sales level, not a recorded drawing): 0.38 dollars per $2 ticket; $263 million jackpot: 0.52 dollars per $2 ticket; $2.04 billion record: 1.69 dollars per $2 ticket (highlighted); Record, if no one could share it (not real): 2.44 dollars per $2 ticket; Ticket price: 2 dollars per $2 ticket. Mathematical model; assumptions: Every combination of five white balls from 1-69 and one Powerball from 1-26 is equally likely, and drawings are independent. No number choice, pattern, history or system changes the odds of any single play; only buying more distinct combinations raises jackpot probability. Multiple tickets in one drawing are assumed to be distinct combinations.BOOK OF ODDSModeled expected value ofone $2 Powerball ticket byadvertised jackpot, afterlump sum, 37% federal taxand split risk$20 million jackpot0.31 dollars per $2 ticket$100 million jackpot (modeled sales level,not a recorded drawing)0.38 dollars per $2 ticket$263 million jackpot0.52 dollars per $2 ticket▶ $2.04 billion record1.69 dollars per $2 ticketRecord, if no one could share it (not real)2.44 dollars per $2 ticketTicket price2 dollars per $2 ticket0 to 2.44 dollars per $2 ticket · zero baseline · ▶ =highlightedMathematical model · Every combination of fivewhite balls from 1-69 and one Powerball from 1-26is equally likely, and drawings are independent. Nonumber choice, pattern, history or system changesthe odds of any single play; only buying moredistinct combinations raises jackpot probability.Multiple tickets in one drawing are assumed to bedistinct combinations.
Mathematical model · Every combination of five white balls from 1-69 and one Powerball from 1-26 is equally likely, and drawings are independent. No number choice, pattern, history or system changes the odds of any single play; only buying more distinct combinations raises jackpot probability. Multiple tickets in one drawing are assumed to be distinct combinations.
View the data table
Outcome
$20 million jackpot0.3100
$100 million jackpot (modeled sales level, not a recorded drawing)0.3800
$263 million jackpot0.5200
$2.04 billion record1.6900
Record, if no one could share it (not real)2.4400
Ticket price2

Expected value is the long-run average a ticket pays back. It is not what any one ticket returns: nearly every ticket returns nothing, and a very few return a lot. Think of it as the part of your $2 that comes back on average across a huge number of tickets.

Three things shrink the advertised jackpot before it reaches you. First, the headline number is an annuity paid over time, and the lump-sum cash option is smaller: $170.2 million cash for a $409 million jackpot in September 2026 (41.6%), and $997.6 million for the $2.04 billion record (48.9%). Second, taxes. The IRS withholds 24% on lottery wins of $5,000 or more, but for tax year 2026 the top federal rate is 37%, applying to single incomes above $640,600, so a jackpot winner owes about 37% on most of the prize. Third, sharing, from the model above.

Put those together and our model gives these expected values per $2 ticket:

  • Non-jackpot prizes alone: about $0.32 before tax, or $0.29 after 37% tax on the $1 million tier.
  • All prizes at a $20 million jackpot: about $0.31.
  • At a $100 million jackpot: about $0.38. This case assumes a modeled sales level, not a recorded drawing.
  • At a $263 million jackpot: about $0.52.
  • At the $2.04 billion record: about $1.69.

The record ticket is the interesting one. Ignore sharing and it would have been worth about $2.44, more than its price. But with roughly 270 million other plays in that drawing, a winning ticket could expect to keep about 0.653 of the jackpot on average. Expected sharing is what pulls the record ticket below $2, and state taxes, which we did not model, push it lower still. If you see a calculation that shows a profitable ticket at a giant jackpot, check whether it counted taxes and splitting. Bigger jackpots also sell more tickets, which raises the chance of sharing.

Power Play costs $1 more per play and multiplies non-jackpot prizes. It never touches the jackpot odds. When the 10X multiplier is available, at jackpots of $150 million or less, the multiplier is 10x with odds of 1 in 43, 5x at 2 in 43, 4x at 3 in 43, 3x at 13 in 43 and 2x at 24 in 43. At bigger jackpots it is 5x, 4x, 3x or 2x at 2, 3, 13 and 24 in 42. A Match 5 with Power Play pays $2 million at any multiplier.

Our model puts the add-on’s expected extra prizes at about $0.50 per $1 when the 10X is available and about $0.46 when it is not, before tax. That is an expected loss of about half of every dollar.

✱ The Outlier

Be the interesting one at dinner.

One email. A few surprising odds. Plenty to talk about.

Email signup opens soon.

If you play: what to do and what to skip

THE PLAN

How to play Powerball sensibly, if you play

Six decisions for one $2 play per drawing, each backed by lottery data or modeled expected value

  1. Set a budget you can afford to lose

    At typical jackpots a $2 ticket returns about $0.31 to $0.52 on average. Even the $2.04 billion record ticket was worth about $1.69.

  2. Pool only if you accept sharing

    Four friends with four different tickets get four times the chance of a payout, each a quarter the size, so expected return per dollar matches solo play.

  3. Quick pick or self-pick: your call

    About 70% of plays are quick picks (Minnesota Lottery), and about 70% to 80% of winners and jackpot winners hold them (Minnesota Lottery; MUSL via WTHR).

  4. If you pick, go above 31 and skip patterns

    Less popular numbers lower your chance of sharing a jackpot. They do not change your chance of winning it.

  5. Add Power Play only as a priced extra

    The $1 add-on returns about $0.46 to $0.50 in expected extra prizes and is only sold with a base play.

  6. Skip hot/cold numbers, wheels and systems

    Machines and ball sets are randomized before each drawing under independent auditors. A wheel only buys more $2 tickets.

Powerball.com; Minnesota Lottery; MUSL via WTHR; Rutgers University; Book of Odds model

Modeled EVs: lump-sum cash, 37% federal tax, split risk, no state tax. Power Play values pre-tax.
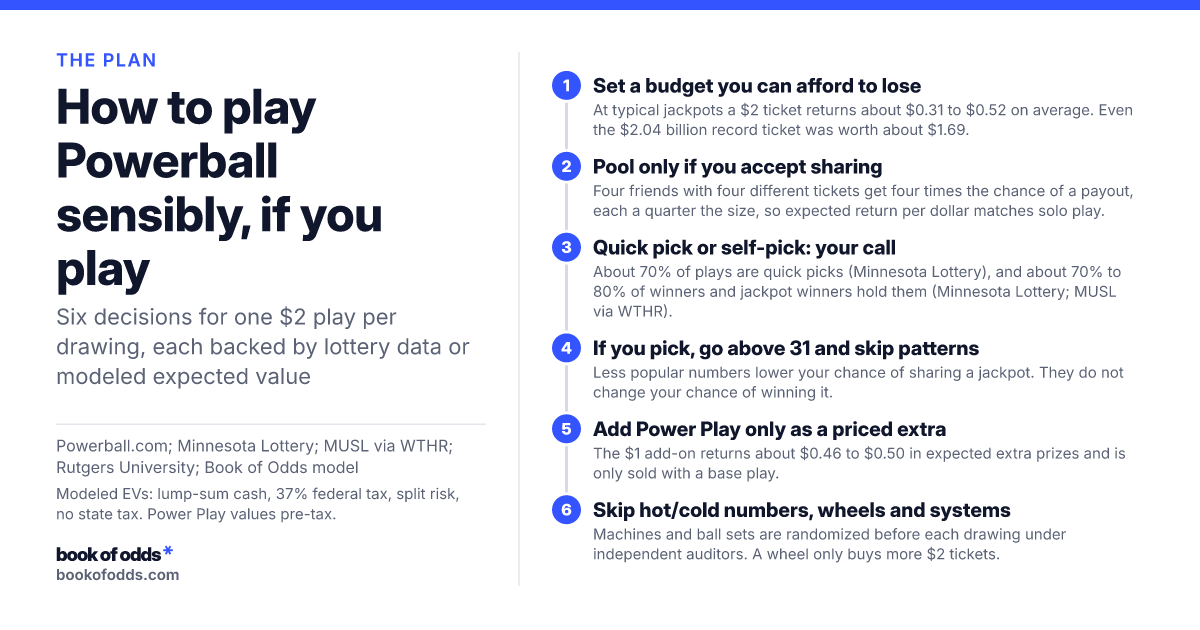
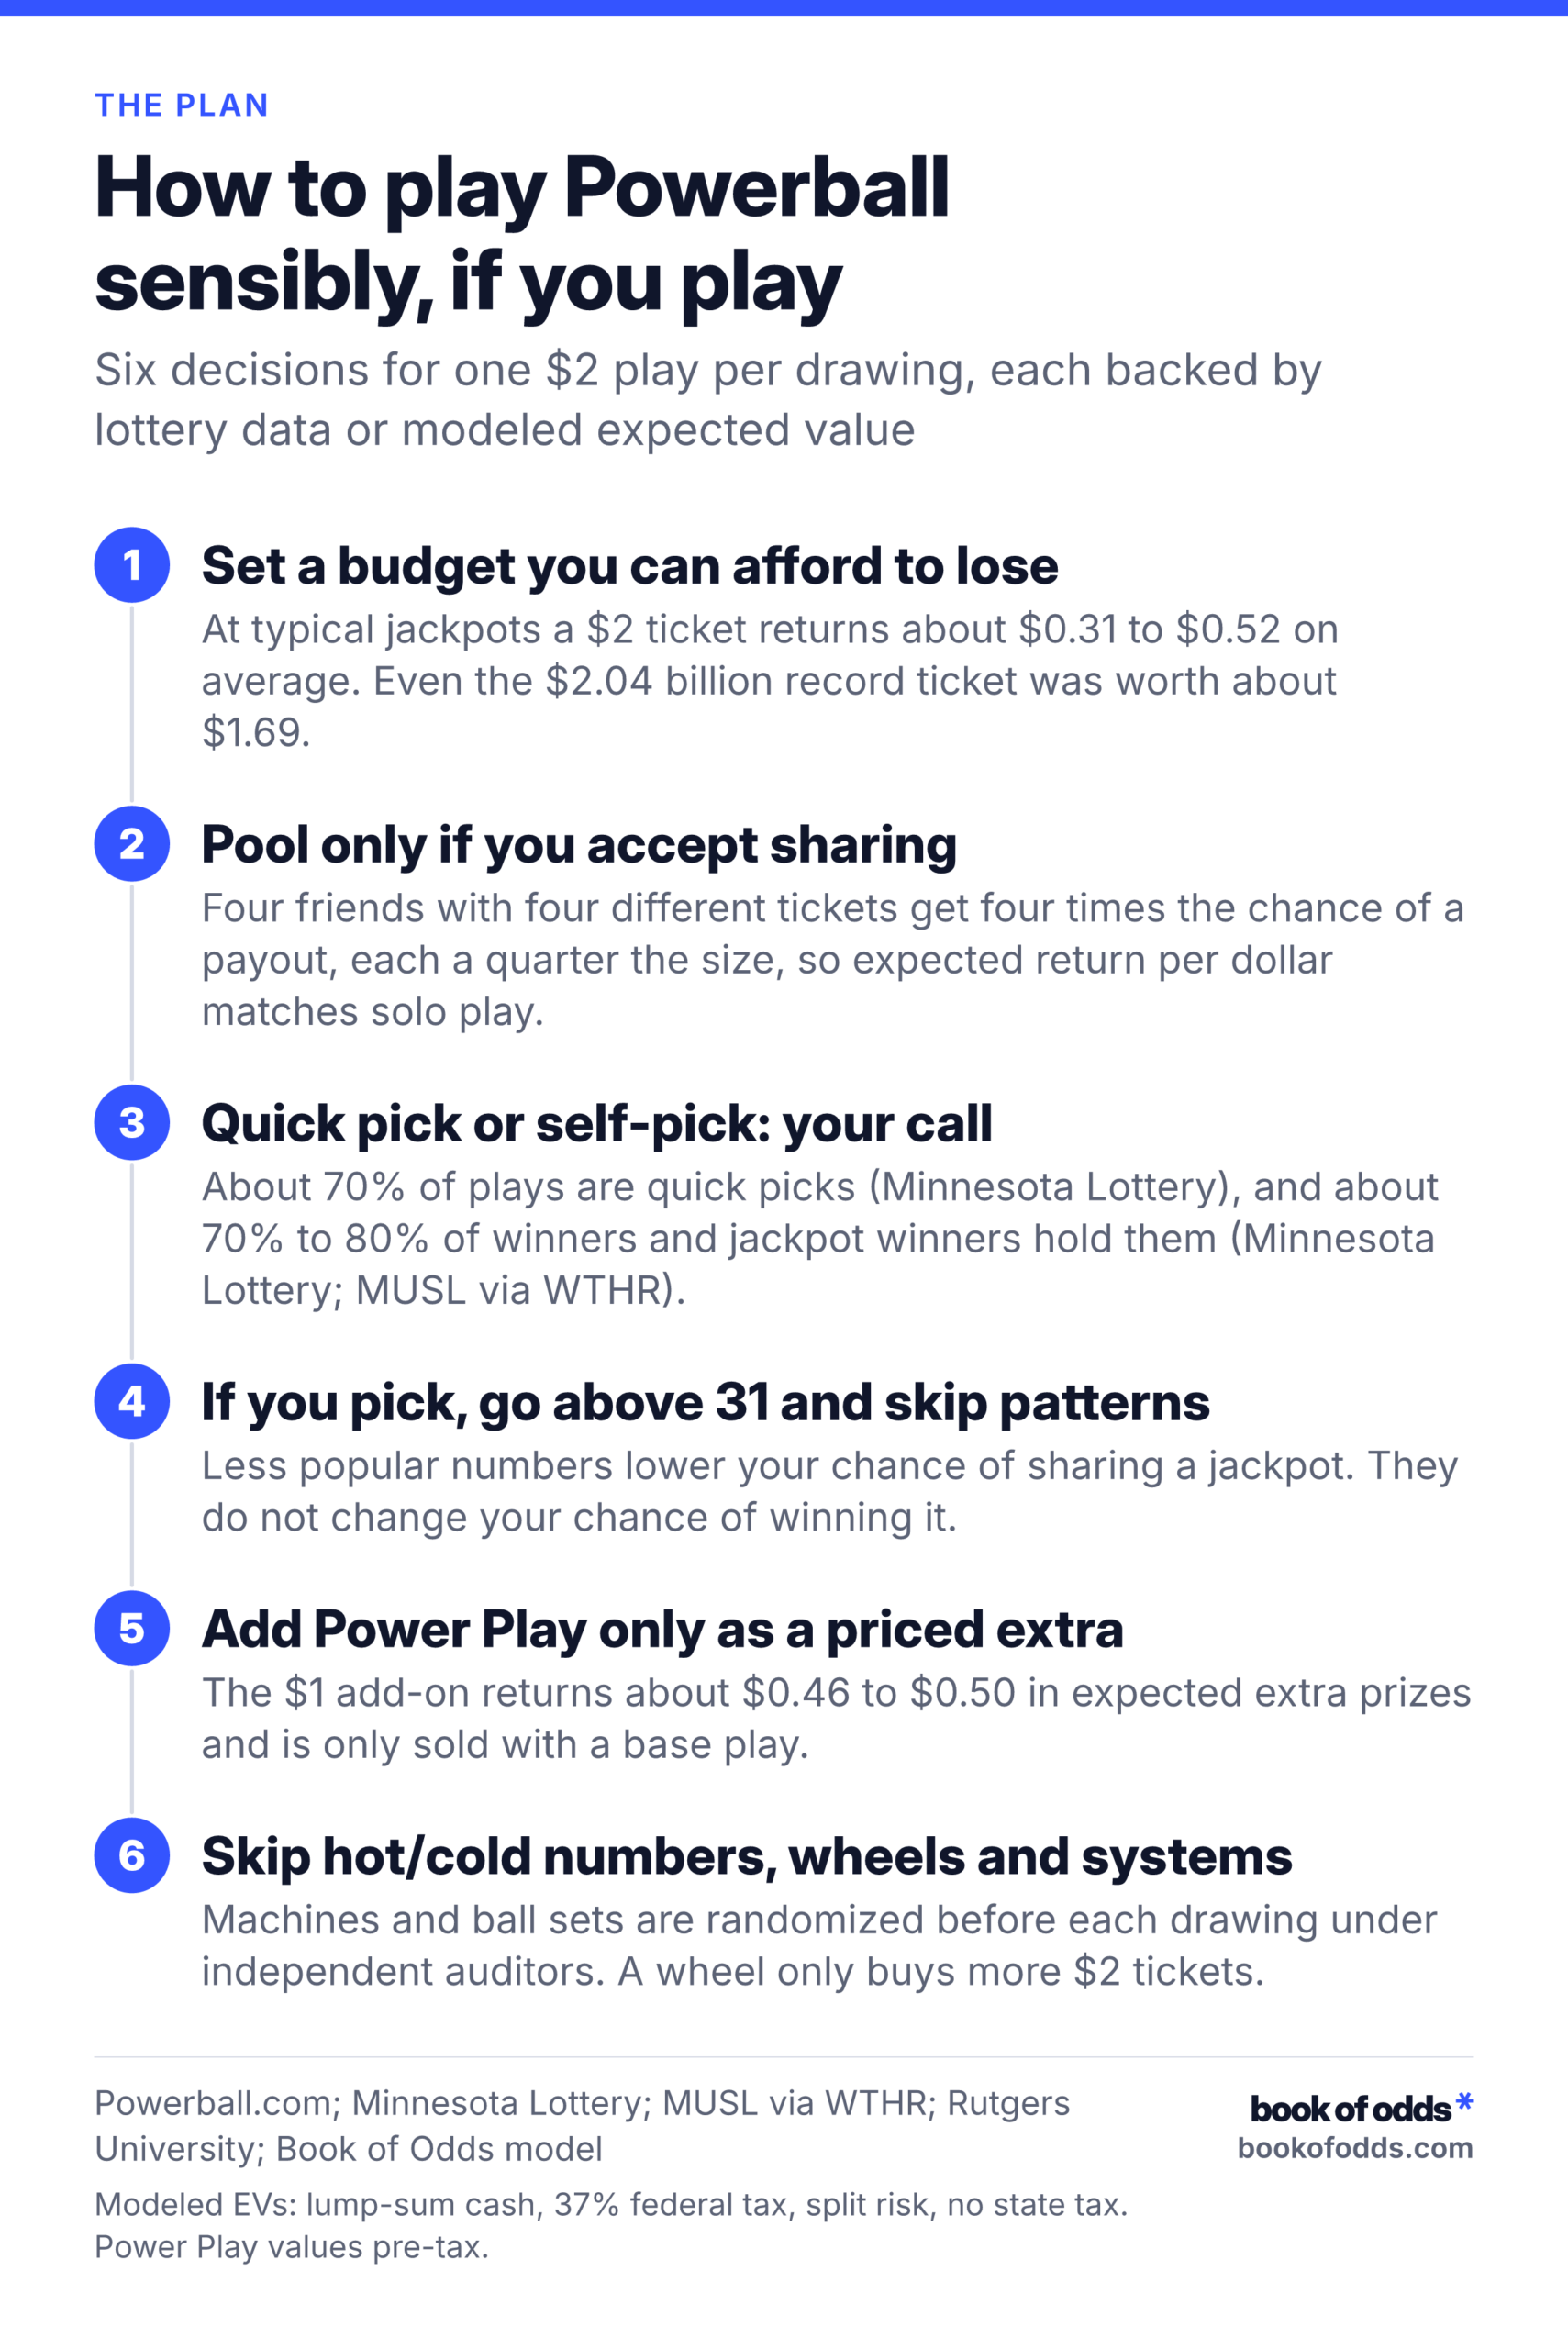
The graphic above is the plan. Here is the skip list, with the figure behind each item.

  • Hot and cold numbers. Machines and ball sets are chosen at random before each drawing and checked under independent auditors, so past results do not steer the next one.
  • Patterns on the slip. In the Dutch Lotto study, they appeared in 0.9% of entries versus 0.009% expected at random, so a pattern ticket keeps the same odds and raises your chance of sharing.
  • Wheels and systems sold online. They buy combinations at $2 each, which you can do without paying for a system, or they do nothing.
  • Waiting for a record jackpot to make the ticket worth it. Even the $2.04 billion record ticket was worth about $1.69 in our model, and at that level of sales a winning ticket had a modeled 61% chance that another ticket also won.

None of this says you shouldn’t play. It says a ticket is entertainment with a price tag, and now you know the price.

What changed
  • : Added the Minnesota Lottery FAQ to the sources.
  • The old page said 31 states took part in Powerball in 2009 (1 in 1.67, or 60%, of states). Powerball is now sold in 45 states, the District of Columbia, Puerto Rico and the U.S. Virgin Islands, because the game has expanded since 2009. The old page said drawings were held twice a week in Orlando. They are now held three times a week, Monday, Wednesday and Saturday at 10:59 pm ET, at the Florida Lottery draw studio in Tallahassee, after a Monday drawing was added on August 23, 2021. The old page described a drum of 59 white balls and 39 red balls. Since October 2015 the game draws five white balls from 1 to 69 and one Powerball from 1 to 26, because the number matrix was changed. The old page gave jackpot odds of 1 in 195,249,054 (rounded to 1 in 195,200,000). That was correct for the 5/59 + 1/39 game of the time; under today's matrix the odds are 1 in 292,201,338 per $2 play. The old page's with-replacement and ordered counts (27,882,047,661 and 23,429,886,480) were correct arithmetic for the old 59/39 game, but that game no longer exists and today's game has 292,201,338 combinations. The old page said there was about an 88% chance no one wins a drawing, based on an unverified average of 13.5 winners a year. The chance of no winner depends on sales: modeled at about 98% for a drawing of about 6 million plays, 95% at about 16 million and about 39% at about 275 million (record level). The old page gave per-drawing chances of 11% for one winner, 0.73% for two and 0.03% for three. The Poisson arithmetic was consistent with its 0.1298 average, but current modeled chances vary with sales, for example one winner about 2% at about 6 million plays and about 37% at about 275 million, with two or more winners about 24% at the latter. The old page said two tickets a week would take 1,877,366 years to buy 195,249,054 tickets. That was a small arithmetic slip (about 1,877,395 years), and in today's game buying all 292,201,338 combinations at two tickets a week would take even longer. The old page said 47,000 tickets a week for 80 years would total about 195 million tickets. That was right for the old game; covering today's 292,201,338 combinations in 80 years would take more tickets a week. The old page said the Klincewicz syndicate won about £1 million with a marginal profit. The jackpot was shared three ways, so the syndicate received one-third of the £1.7 million jackpot (£568,682) plus lower-tier prizes, after spending an estimated £820,000 on tickets.

Sources

  1. Powerball Prize ChartMulti-State Lottery Association (Powerball.com) · Data year 2026 · Accessed 2026-10-01 · Primary source
  2. PowerballVirginia Lottery · Data year 2026 · Accessed 2026-10-01
  3. Powerball — Prizes & OddsConnecticut Lottery · Data year 2026 · Accessed 2026-10-01
  4. Powerball HomeMulti-State Lottery Association (Powerball.com) · Data year 2026 · Accessed 2026-10-01 · Primary source
  5. Powerball – How to PlayNorth Carolina Education Lottery · Data year 2026 · Accessed 2026-10-01
  6. PowerballLouisiana Lottery · Data year 2026 · Accessed 2026-10-01
  7. Watch the DrawingMulti-State Lottery Association (Powerball.com) · Data year 2026 · Accessed 2026-10-01 · Primary source
  8. POWERBALL® to Launch Third Weekly Drawing on Monday NightsDC Lottery · Data year 2026 · Accessed 2026-10-01
  9. Media CenterMulti-State Lottery Association (Powerball.com) · Data year 2026 · Accessed 2026-10-01 · Primary source
  10. Changes to Powerball game coming in OctoberNorth Carolina Education Lottery · Data year 2015 · Accessed 2026-10-01
  11. LOTTO GAMES FAQMinnesota Lottery · Accessed 2026-10-01
  12. What to know about the $1.9 billion Powerball jackpotWTHR (quoting Multi-State Lottery Association) · Data year 2022 · Accessed 2026-10-01
  13. Number preferences in lotteries (Judgment and Decision Making, 2016)Judgment and Decision Making (Wang, Potter van Loon, van den Assem, van Dolder) · Data year 2016 · Accessed 2026-10-01 · Primary source
  14. How to Pick Winning Lottery Numbers, Rutgers Statistician Weighs InRutgers University · Data year 2022 · Accessed 2026-10-01 · Primary source
  15. The Lotto Report – 2025 Powerball Sales by StateThe Lotto Report (Dawn Nettles, hobbyist) · Data year 2025 · Accessed 2026-10-01
  16. Ticket in California Wins World Record $2.04 Billion Powerball JackpotMulti-State Lottery Association (Powerball.com) · Data year 2022 · Accessed 2026-10-01 · Primary source
  17. Instructions for Forms W-2G and 5754 (01/2026)Internal Revenue Service · Data year 2026 · Accessed 2026-10-01 · Primary source
  18. IRS releases tax inflation adjustments for tax year 2026Internal Revenue Service · Data year 2026 · Accessed 2026-10-01 · Primary source
  19. National Lottery (Ireland)Wikipedia · Data year 1992 · Accessed 2026-10-01
  20. The syndicate who tried to beat the lotto – inside the new filmRTÉ · Data year 1992 · Accessed 2026-10-01
  21. Va. investigates lottery winnersTampa Bay Times (St. Petersburg Times) · Data year 1992 · Accessed 2026-10-01
  22. JACKPOT GOING TO AUSTRALIA VIRGINIA SET TO OK $27 MILLION TICKETRoanoke Times (Virginia Tech archive) · Data year 1992 · Accessed 2026-10-01 · Primary source
  23. Inside the secure room where Powerball equipment is kept10News (ABC San Diego) · Data year 2022 · Accessed 2026-10-01

How we calculated

Jackpot odds: five white balls from 69 can be chosen in C(69,5) = 11,238,513 ways, times 26 Powerballs, for 292,201,338 equally likely combinations; one $2 play holds one. Tier odds and the 1 in 24.87 any-prize odds come from the Powerball.com prize chart and were cross-checked by calculation. Quick pick shares come from the Minnesota Lottery's Lotto Games FAQ (about 70% of plays and of winners) and from the Multi-State Lottery Association as quoted by WTHR in 2022 (roughly 80% of jackpot-winning tickets). Cumulative odds: for one player buying 1, 5 or 20 different combinations in each of 156 drawings a year, the chance of at least one jackpot is 1 minus (1 minus 1/292,201,338) raised to the power (tickets per drawing x 156 x years), assuming distinct combinations and independent drawings. These are modeled, not observed. Pools: a group holding one different combination per member has that many chances in 292,201,338 per drawing, and each member owns an equal share of any prize (a quarter in a pool of four), so with equal stakes and different combinations the expected gross return per dollar equals solo play, while the chance of receiving a payout rises and its size falls. Split model: a Poisson model with lambda = plays / 292,201,338 gives the chance per drawing of no winner, one winning ticket, or two or more, and, given that your ticket wins, the chance at least one other ticket also wins (1 – e^-lambda, lambda = other plays / 292,201,338), treating every play as an independent uniform pick (real players cluster on popular numbers, so splits on popular combinations are somewhat likelier). Plays per drawing are draw sales divided by $2, from The Lotto Report (a hobbyist tracker) for January 2025: $12,354,962 (about 6.18 million plays) and $32,845,078 (about 16.4 million). The record Nov. 7, 2022 drawing is inferred from winner counts: 11.2 million prize-winning tickets x 24.87 is about 278.5 million, and 23 Match 5 winners x 11,688,053.52 is about 270 million, so about 270 million to 280 million plays. 100 million plays is a modeling level, not a recorded drawing. Expected value per $2 ticket: lump sum of 41.6% of the advertised jackpot for typical jackpots and the $997.6 million cash value for the record; 37% federal tax on the jackpot and the $1 million tier; smaller prizes untaxed; state taxes ignored; a winning ticket expects to keep (1 – e^-lambda)/lambda of the jackpot, where lambda counts other plays (0.653 at the record). The $100 million case assumes 8.4 million plays, a modeled sales level chosen between the two January 2025 data points, not a recorded drawing. Power Play: average multipliers of 2.767 (10X available) and 2.595 (no 10X), applied to non-jackpot, non-Match 5 prizes, plus the extra $1 million on Match 5; fixed prizes, pre-tax, California not modeled. The per-dollar comparison divides the base ticket's $0.31 to $0.52 by its $2 price and sets it against Power Play's $0.46 to $0.50 per $1. Buyout: 292,201,338 x $2, about 60 hours between drawings, ignoring printing and retailer limits, with expected lower-tier prize income of about $93.5 million pre-tax. All of these are modeled, not observed. Rounding: exact combinatorial odds are shown in full; the 20-ticket odds to three significant figures in millions; percents to one decimal above 1% and two significant figures below; dollars to cents; inferred play counts to two or three significant figures.

✱ The Outlier

Be the interesting one at dinner.

One email. A few surprising odds. Plenty to talk about.

Email signup opens soon.