

Are you more likely to die in an elevator, on an escalator or on the stairs?
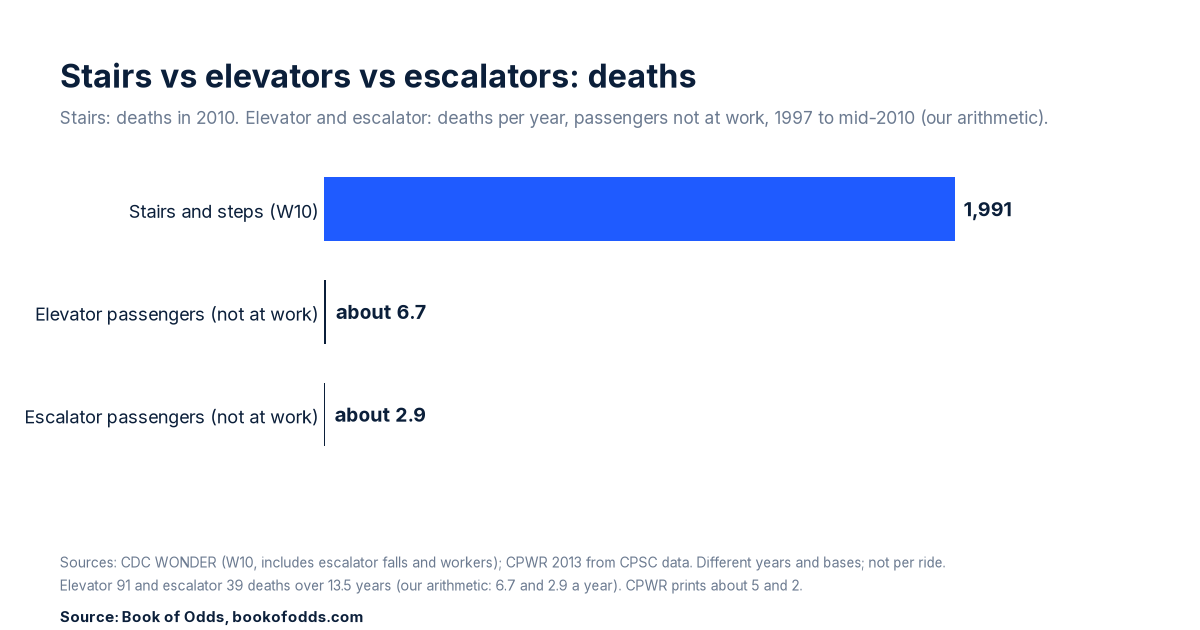
The stairs, by a wide margin: falls on stairs and steps (an international disease code that also includes falls on escalators, inclines and ramps, and on icy steps) killed 1,991 people in the United States in 2010, about 1 in 155,000 residents, according to CDC death certificate data.
From 1997 to mid-2010, a stretch of about 13.5 years, the Consumer Product Safety Commission (CPSC) recorded 91 deaths of elevator passengers and 39 deaths of escalator passengers who were not at work, according to a 2013 report by CPWR, the Center for Construction Research and Training. That is about seven and about three a year by our arithmetic; CPWR itself prints about five and two.
Picture the lobby
Imagine a lobby with three ways up: an elevator with a polite chime, an escalator humming, and a stairwell door that nobody ever holds open for you. (The lobby is imagined; the numbers are not.) Rank them by how much you trust machinery and the stairs come last on your worry list. The death records flip the list.
How wide is “a wide margin”?
Put all three on one basis: deaths per person per year across the U.S. population. They share one denominator, the 2010 Census count of 308,745,538 residents, so the comparison comes down to deaths per year.
| Way up | Deaths | Period | Per year | Odds per person per year |
|---|---|---|---|---|
| Stairs and steps | 1,991 | 2010 | 1,991 | about 1 in 155,000 |
| Elevator, passengers not at work | 91 | 1997 to mid-2010 | about 6.7 | about 1 in 46 million |
| Escalator, passengers not at work | 39 | 1997 to mid-2010 | about 2.9 | about 1 in 107 million |
On that basis the stairs come out roughly 300 times the elevator passenger toll (1,991 divided by 6.7) and roughly 700 times the escalator one (1,991 divided by 2.9).
The periods do not match: the stairs figure is a single year, while the machine figures are averages over 1997 to mid-2010, and stair deaths rose from 1,421 in 1999, the first year in that database, to 1,991 in 2010. Use the stairs average for 1999 to 2010, about 1,694 a year, and the multiples fall to roughly 250 and 600. Use CPWR’s own rounded figures for the machines, “about five” and “about two” a year, and they rise to roughly 400 and 1,000. On this passenger basis the gap never drops below about 250 times.
This is not per ride
This is not a per-ride risk. It is deaths per person per year. No source we found counts how many trips people take on each, so we cannot tell you whether one flight of stairs is riskier than one elevator ride. What they do say: across a year and a country, stairs account for far more deaths than both machines combined.
What the stairs count includes
The stairs figure comes from death certificates coded W10 in the international disease classification, “fall on and from stairs and steps.” That code also covers falls on escalators, ramps, inclines and icy steps, and the CDC database we used does not split them out, so some escalator deaths may be counted on both sides. CPWR counts 29 of the 39 escalator passenger deaths as falls over the whole 13.5 years, so by our reading the possible double count is small next to 1,991 stair deaths in one year.
W10 also counts people who fell on stairs while working. The 91 and the 39 leave workers out, so here is the broadest elevator count.
Counting everyone in the elevator shaft
CPWR puts elevator-related deaths at an average of 25 a year across work and passenger categories, and most are not passengers at all. There were 263 elevator-related deaths among people working in or near elevator shafts and elevators from 1992 to 2009, about 15 per year, and 89 deaths of passengers at work over the same years, about five per year.
Divide the 2010 population by 25 and the odds are about 1 in 12 million per person per year. Divide each subgroup count by its years and add them, and you get about 27 deaths a year, or about 1 in 11 million. The work counts cover 1992 to 2009 and the not-at-work passenger count 1997 to mid-2010, so the windows differ. Hence a range: roughly 1 in 11 to 12 million.
The gap between 25 and 27 has a source. CPWR’s text describes the 91 non-work passenger deaths as “about five deaths per year,” but 91 deaths over about 13.5 years works out closer to seven. CPWR’s summary table lists passengers not at work as 5 elevator, 2 escalator and 7 in total. The 7 is the two machines combined, not a corrected elevator figure. The 25 uses the 5; the 27 uses the raw counts.
Even on that broadest count, the stairs come out roughly 70 to 80 times higher (1,991 divided by 27, then by 25). CPWR’s table gives escalators about 3 deaths a year across all groups, which leaves the stairs roughly 660 times higher. The margin narrows when the shaft workers join the count. It does not close.
What this does not tell you
It is not today’s risk. The machine figures end in mid-2010, and we found no newer public national count. Stair deaths were higher still in 2020: 2,669 in the same CDC database.
It is not like for like on counting method. The stairs figure is a complete count of U.S. death certificates. The machine figures are deaths reported to the CPSC and compiled by CPWR, a secondary source, and in our reading reported deaths may miss some, so the true machine figures could be somewhat higher.
Back in the lobby
Take any way up you like. The one with no motor and no cables is the one with the long count: 1,991 deaths in 2010, about 1 in 155,000 residents, against about seven elevator passengers and about three escalator passengers a year, not at work, 1997 to mid-2010.
Sources and method
- CDC WONDER, Underlying Cause of Death, 1999 to 2020, ICD-10 code W10, United States, by year (queried October 16, 2026): https://wonder.cdc.gov/ucd-icd10.html. The 2010 and 2020 figures match NCHS and National Safety Council tables reproduced by the Insurance Information Institute: https://www-legacy.iii.org/table-archive/20382
- W10 inclusions, WHO ICD-10 via the NHS classification browser: https://classbrowser.nhs.uk/ICD-10-5TH-Edition/vol1/block-w00-w19.htm
- CPWR, Deaths and Injuries Involving Elevators and Escalators, Michael McCann, September 2013: https://www.cpwr.com/wp-content/uploads/elevator_escalator_BLSapproved_2.pdf. A note on versions: the built-in document title of the cpwr.com PDF reads “DRAFT” and “NOT FOR DISTRIBUTION”, though no printed page says so. We cite that copy. A copy archived on CDC Stacks (https://stacks.cdc.gov/view/cdc/221302) is cataloged as published September 1, 2013, and every figure we use reads the same in both.
- U.S. Census Bureau, 2010 Census resident population of 308,745,538 (press release CB10-CN.93): https://www.census.gov/newsroom/releases/archives/2010_census/cb10-cn93.html
Method: odds are the 2010 population divided by deaths per year, rounded once. Machine deaths per year are CPWR counts divided by about 13.5 years. Each multiple is one yearly death figure divided by another.
Last checked and corrections
Last checked: October 16, 2026. Spotted an error or a newer public figure? Please tell us on our contact page with the article link and we will review it.