The short answer
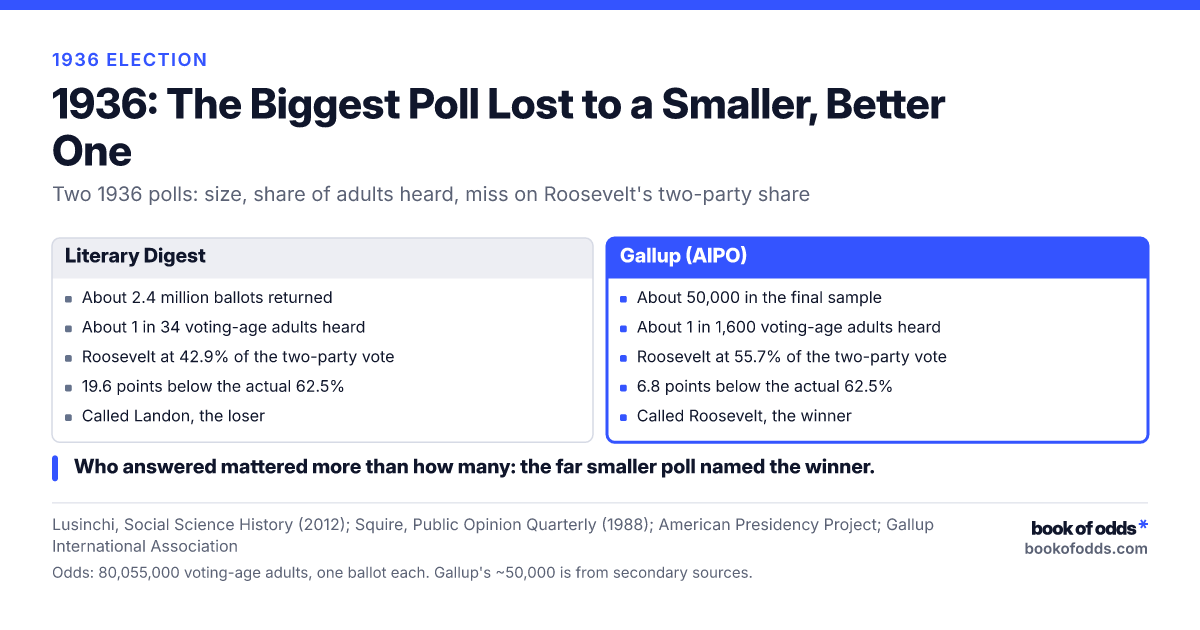
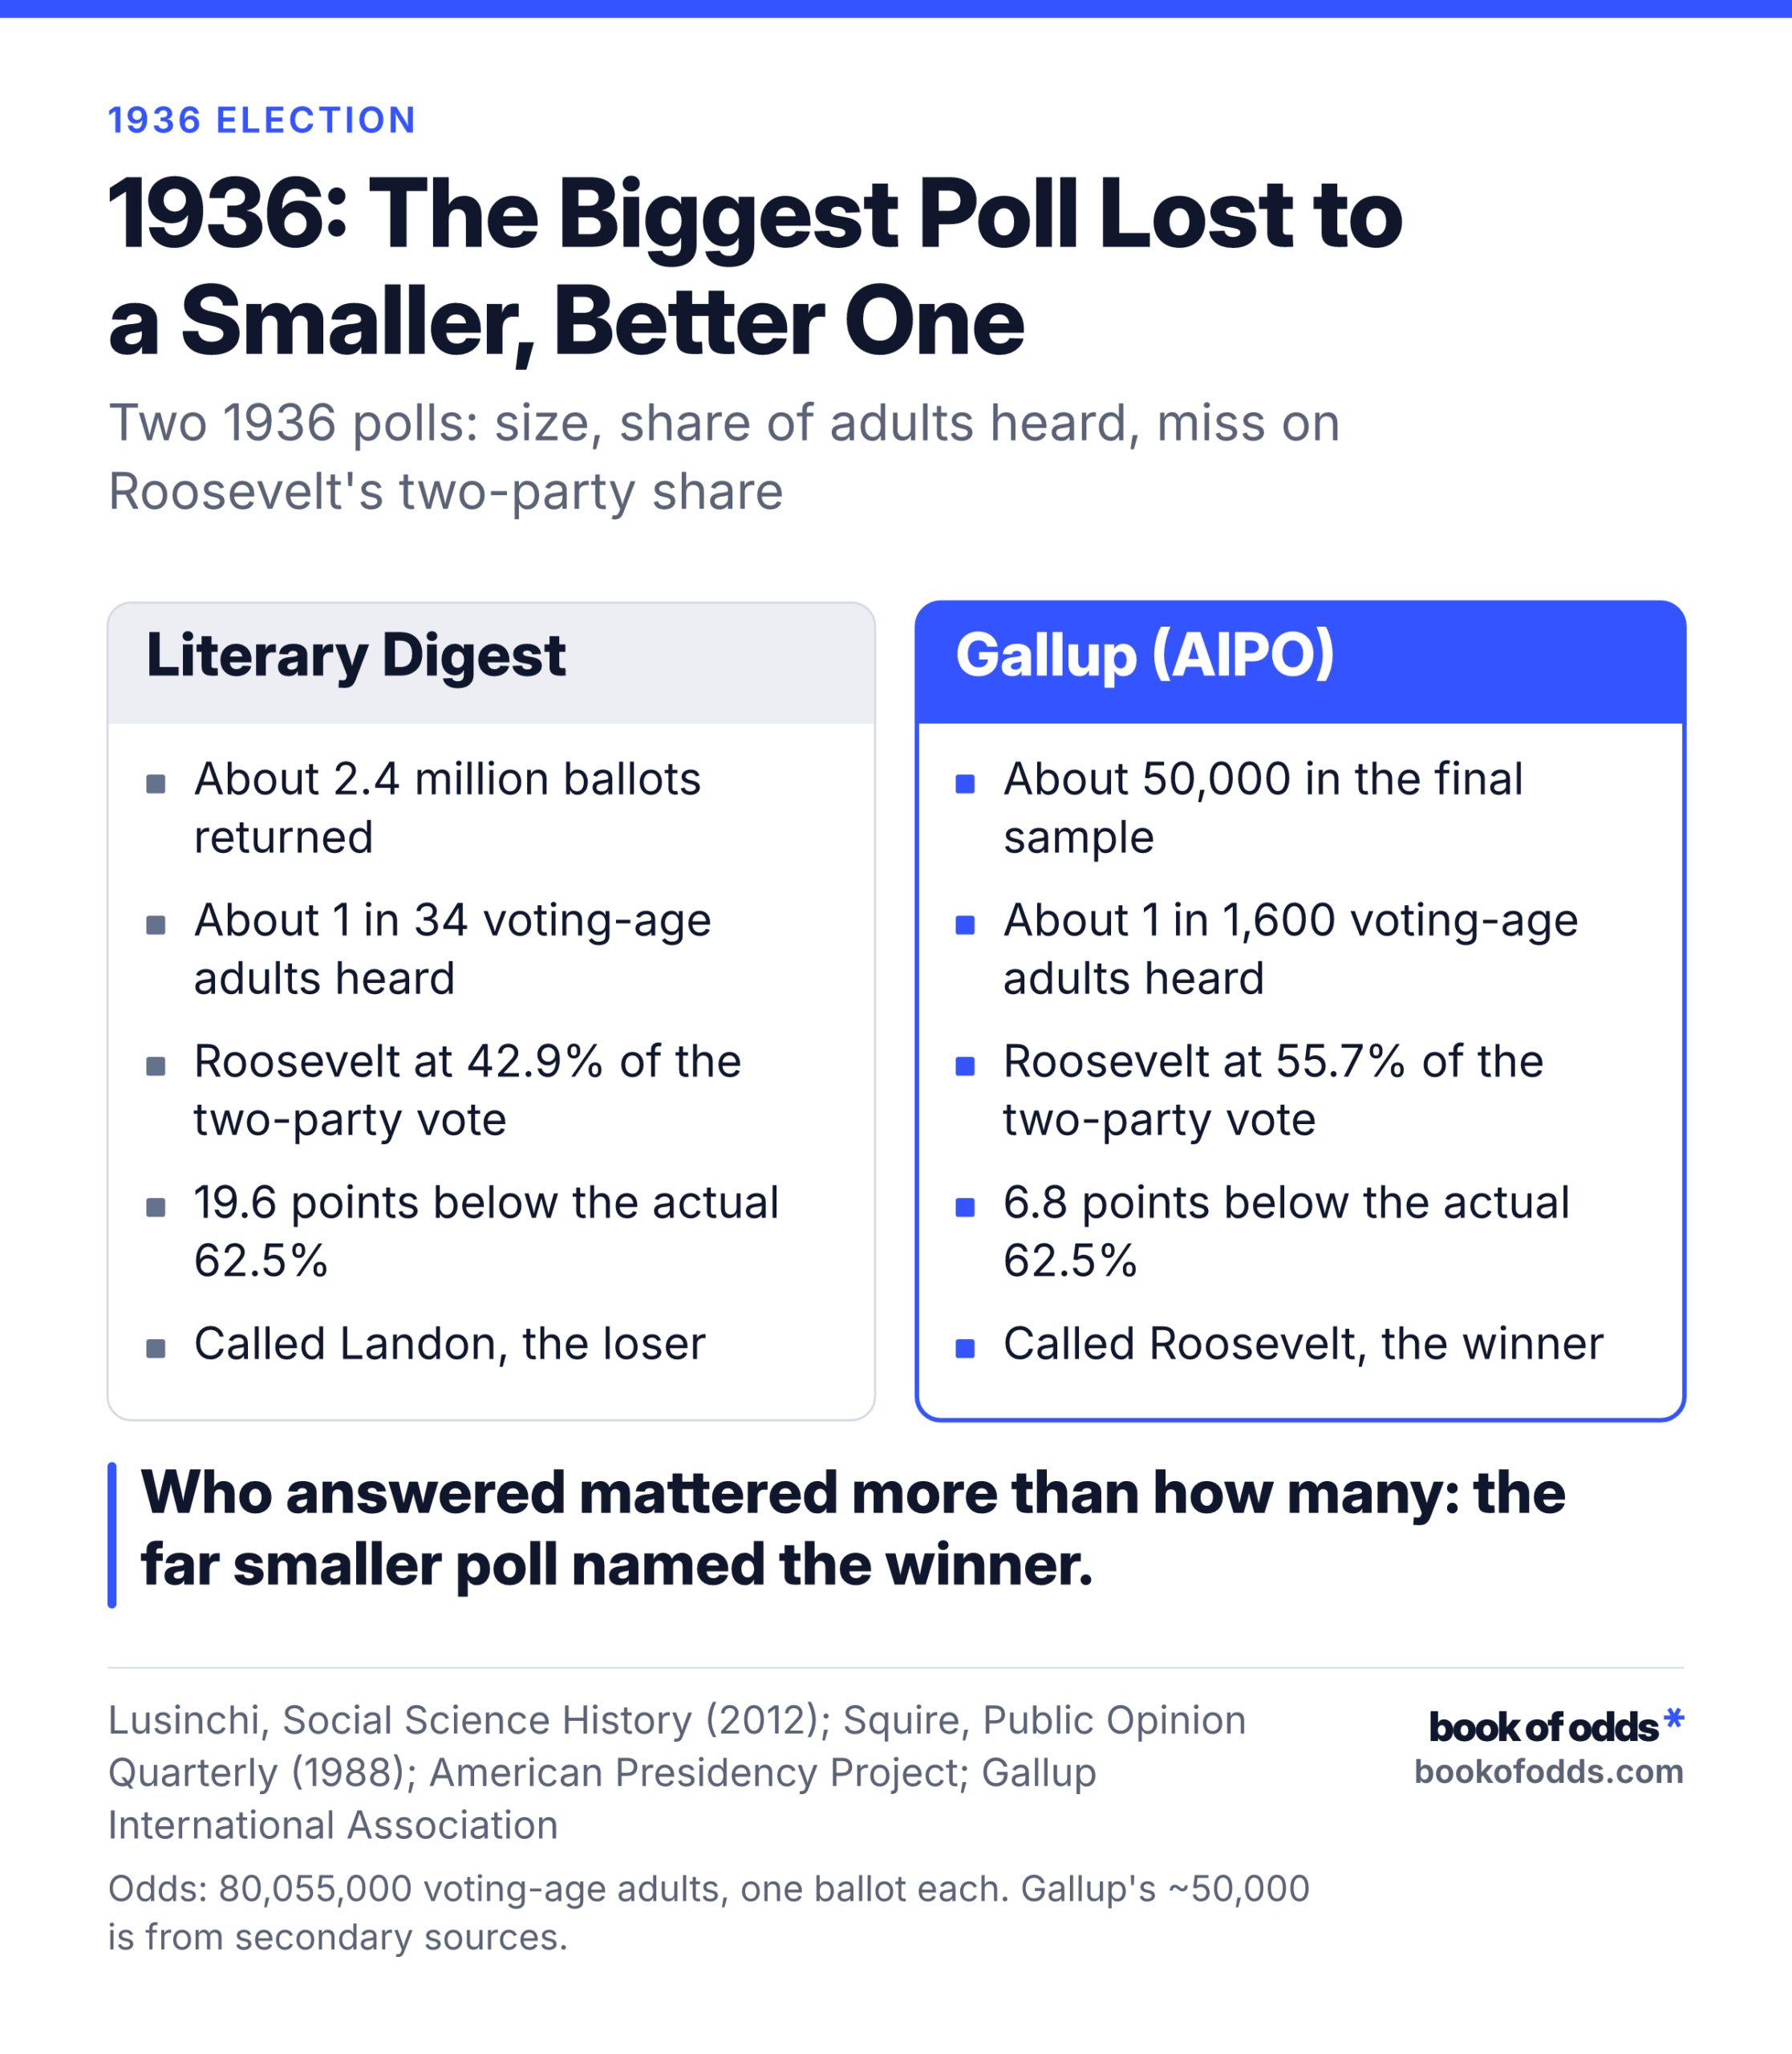
In the fall of 1936, the Literary Digest heard back from 2,376,523 people. That is about 1 in 34 American adults of voting age (21 and older at the time). Its poll still said Alf Landon would beat Franklin Roosevelt. Roosevelt won in a landslide.
George Gallup’s final poll heard from about 50,000 people, about 1 in 1,600 adults. He named Roosevelt the winner. Measured on Roosevelt’s share of the two-party vote (his votes divided by his votes plus Landon’s), the Digest missed by 19.6 percentage points. Gallup missed by 6.8.
The short version: who answered mattered far more than how many answered.
A magazine that never missed
The Literary Digest, founded in 1890, was a weekly news magazine with a famous presidential straw poll. A straw poll is an informal vote: you mail people a ballot and count whatever comes back.
By 1936 the Digest had called the winner of every presidential race it had polled. Sources disagree on when that streak began. Some date it to 1916, one to 1920, and one to 1924. None has the Digest missing a winner before 1936.
Its method was size. In 1936 the magazine mailed about 10 million ballot cards. The addresses came mostly from telephone directories and car registration lists, with club rosters, voter rolls and city directories added in. Its own subscriber list was not the main source, whatever many retellings say.
Ten million ballots, one wrong winner
About 2.4 million ballots came back, a response rate of roughly 24%. On October 31, 1936, the Digest printed its final count: Landon 1,293,669, Roosevelt 972,897, and third-party candidate Lemke 83,610. That is Landon 55%, Roosevelt 41%, Lemke 4%. Counting only the two main candidates, Landon led 57% to 43%.
On Election Day, November 3, voters disagreed. Roosevelt took 60.8% of the popular vote to Landon’s 36.5%, which works out to 62.5% of the two-party vote. The Electoral College went 523 to 8. Landon even lost his home state of Kansas, whose 9 electoral votes went to Roosevelt.
The Digest had put Roosevelt at 42.9% of the two-party vote. He got 62.5%. That is a miss of 19.6 points. The magazine folded in 1938, about 18 months after the election.
What were the odds you were asked?
Here is the chance that a randomly chosen voting-age adult in 1936 was heard by each poll, using the Census count of 80,055,000 adults of voting age. A 1-in-N figure is a share of people: 1 in 34 means one adult out of every 34.
- Returned a Digest ballot: about 1 in 34. 80,055,000 divided by 2,376,523 is about 33.7. If you use the rounder 2.4 million, you get 1 in 33.4. Either way, it rounds to about 1 in 34.
- Was handed a Gallup ballot: about 1 in 256. Gallup reported that 312,551 ballots went out in his final poll. 80,055,000 divided by 312,551 is about 256. This is the upper limit on being approached, not on being counted.
- Was in Gallup’s final sample: about 1 in 1,600. 80,055,000 divided by about 50,000 is about 1,601. The 50,000 comes from secondary sources, and no Gallup document confirming it has turned up. If the sample was as small as 30,000, the chance would be 1 in 2,669.
- Is in one typical national poll today: about 1 in 267,000. This assumes a poll of 1,000 people and 266,978,268 voting-age adults in 2024 (18 and older now). A 1,500-person poll would make it about 1 in 178,000.
Gallup’s final sample, at about 1 in 1,600, is the number behind the headline. The Digest heard from about 48 times as many people as he did, and he still got the winner right.
Two caveats. These figures assume one ballot per person and ignore Digest cards that reached people under 21. And each is a one-time share for a single election, not a chance you faced over and over.
What Gallup did differently
Gallup did not try to reach everyone. He used quota sampling: interviewers handed ballots to set numbers of people from different groups, so the sample’s mix resembled the voting public. The Digest took whoever bothered to mail a card back. Gallup decided in advance what his sample should look like.
According to his October 31, 1936 column, his final poll distributed 312,551 ballots. The final sample reported from it was about 50,000.
His boldest move came first. On June 12, 1936, before the Digest’s poll had even begun, Gallup predicted what the Digest would find: Landon 56%, Roosevelt 44%. He got that from a pilot of 3,000 postcards sent to the same kinds of lists the Digest used. The Digest’s final two-party numbers were Landon 57%, Roosevelt 43%. He was within a point of a poll that had not been taken yet.
That 3,000 was the pilot, not his election poll. Some accounts mix the two up.
Gallup’s methods traveled well beyond politics. His audience research also shaped how Hollywood studios developed and promoted films, as Susan Ohmer’s book George Gallup in Hollywood documents.
Why bigger wasn’t better
1936 ELECTION
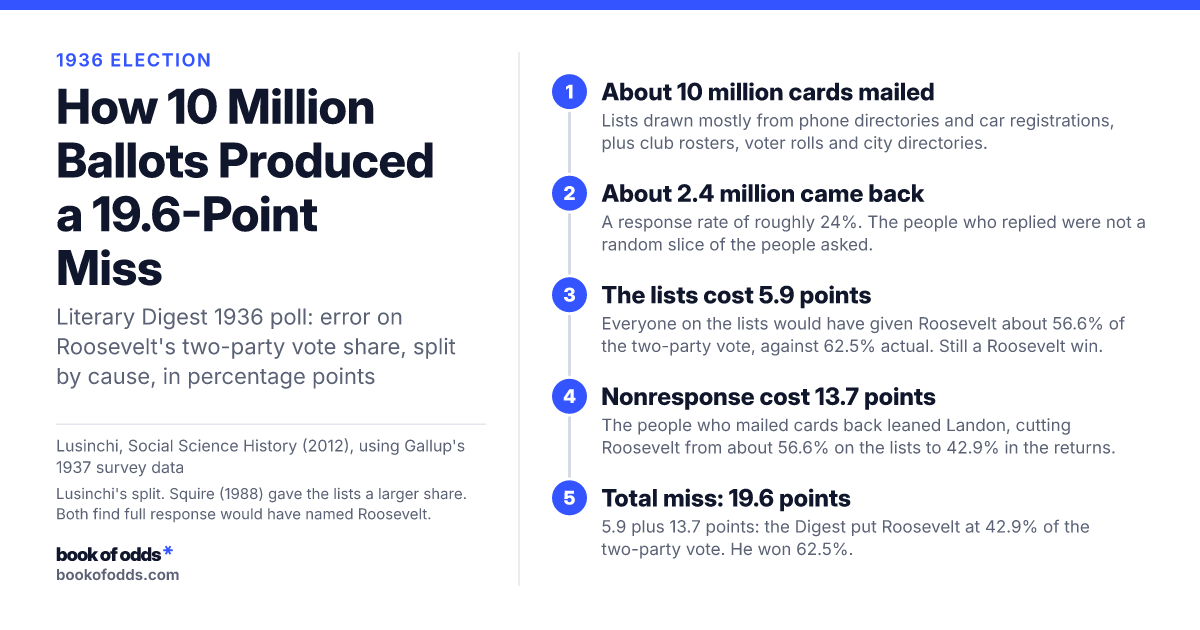
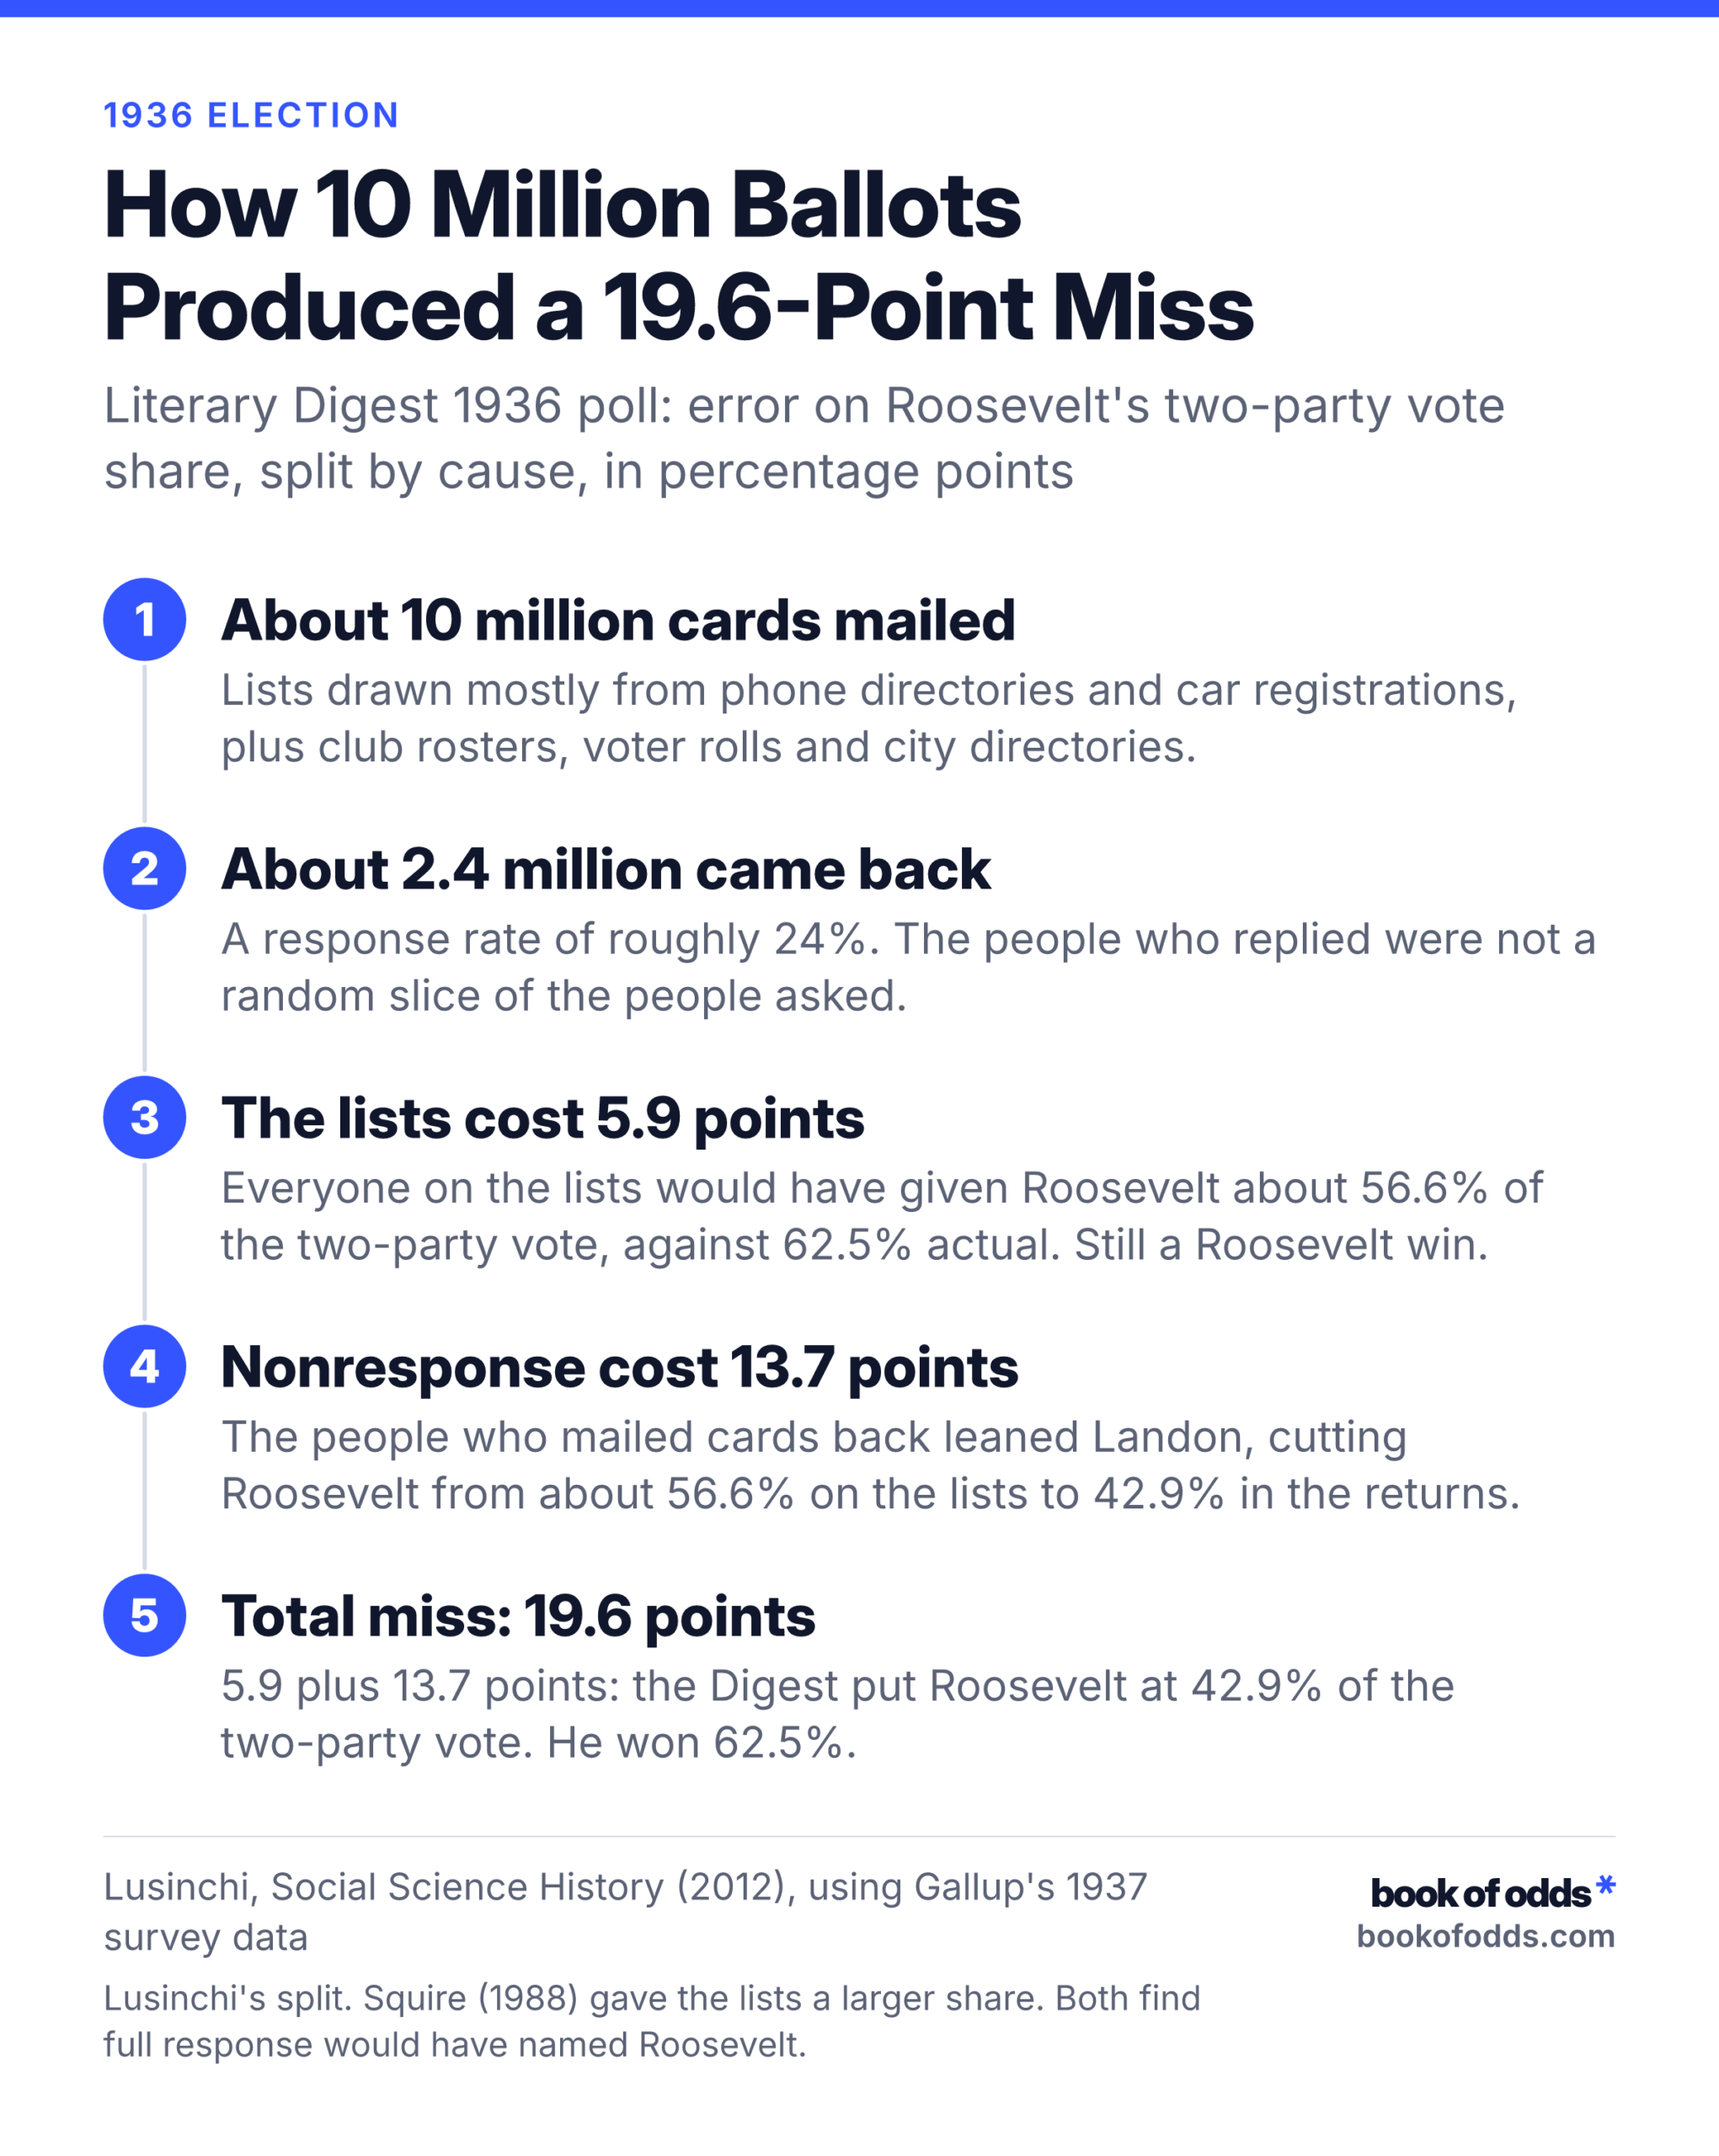
How 10 Million Ballots Produced a 19.6-Point Miss
Literary Digest 1936 poll: error on Roosevelt's two-party vote share, split by cause, in percentage points
About 10 million cards mailed
Lists drawn mostly from phone directories and car registrations, plus club rosters, voter rolls and city directories.
About 2.4 million came back
A response rate of roughly 24%. The people who replied were not a random slice of the people asked.
The lists cost 5.9 points
Everyone on the lists would have given Roosevelt about 56.6% of the two-party vote, against 62.5% actual. Still a Roosevelt win.
Nonresponse cost 13.7 points
The people who mailed cards back leaned Landon, cutting Roosevelt from about 56.6% on the lists to 42.9% in the returns.
Total miss: 19.6 points
5.9 plus 13.7 points: the Digest put Roosevelt at 42.9% of the two-party vote. He won 62.5%.
Lusinchi, Social Science History (2012), using Gallup's 1937 survey data
Lusinchi's split. Squire (1988) gave the lists a larger share. Both find full response would have named Roosevelt.
A poll can go wrong in two separate places. Coverage bias means the list you draw from does not look like the voters. Nonresponse bias means the people who answer do not look like the people who were asked. For example, mail cards to a perfectly balanced list, and if only the president’s critics send them back, your count is still skewed.
The classroom version blames coverage alone. Phone and car owners were rich, rich people voted Republican, so the Digest heard from Republicans. The data do not back that up well. Dominic Lusinchi’s 2012 reanalysis in Social Science History, using Gallup’s 1937 survey data, found that phone and car owners as a group favored Roosevelt, at 53.9%.
The lists were not blameless, though. Lusinchi splits the 19.6-point miss into two parts:
- Who was on the lists (coverage): 5.9 points. Everyone on the Digest’s lists would have given Roosevelt about 56.6% of the two-party vote, against 62.5% actual. That is still a Roosevelt win.
- Who answered (nonresponse): 13.7 points. The people who mailed ballots back dropped Roosevelt from about 56.6% to 42.9%. In effect, Landon supporters were more likely to answer.
So both problems were real, and nonresponse was the larger one in this analysis.
Peverill Squire’s 1988 study in Public Opinion Quarterly, built on Gallup’s May 1937 survey, also found both biases. His rough split put more of the blame on the sample than on nonresponse. Lusinchi argues that the 1937 survey overrepresents Digest respondents, which distorts that kind of estimate. Both authors agree on the part that matters: if everyone polled had responded, the Digest would have named Roosevelt.
A third study shows the Digest had a fix in its own hands. Its ballot asked how people had voted in 1932. Weighting means counting each group in proportion to its known size in the population, here by matching respondents to how the country actually voted in 1932. Sharon Lohr and J. Michael Brick (2017) found that weighting this way would have given Roosevelt 26 states and 276 of 531 electoral votes, a majority. Unweighted, the returns gave him 16 states and 161.
Gallup wasn’t perfect either
View the data table
| Outcome | |
|---|---|
| Literary Digest | 42.9000 |
| Crossley | 53.8000 |
| Gallup (AIPO) | 55.7000 |
| Roper (Fortune Survey) | 61.7000 |
| Actual result | 62.5000 |
Gallup’s final forecast, published November 2, 1936, gave Roosevelt 55.7% of the two-party vote and Landon 44.3%. Roosevelt got 62.5% of the two-party vote, so Gallup was 6.8 points low. He named the right winner with a sizable error. The Digest’s miss, at 42.9% against the same 62.5%, was about three times as large.
Two other pollsters published national forecasts that year. Elmo Roper’s Fortune Survey had Roosevelt at 61.7%, the closest of all and within a point of the result. Crossley had him at 53.8%. Gallup landed between them. The Roper and Crossley figures come from a single university course page, so treat them as less firmly sourced.
Watch the basis when you compare. Gallup’s 55.7% is a share of the two-party vote, so the like-for-like comparison is with Roosevelt’s 62.5% two-party share: a 6.8-point miss. The American Presidency Project’s accuracy table sets the same 55.7% against Roosevelt’s 60.8% of all votes and lists a 5.1-point deviation. That figure mixes two different bases, so it shrinks his miss and is not a fair measure of it. Some reference pages describe Gallup as nearly exact in 1936. His own numbers say otherwise.
You may also see a 66% Roosevelt figure tied to Gallup. It comes from his May 1937 survey, taken after the election, which asked people how they had voted. It overstated Roosevelt’s real vote by about 5 points (65.8% against 60.8%). It was never a forecast. If you find another figure on this page that does not hold up, send it through our contact and corrections page.
Gallup’s own reckoning came in 1948. He, Roper and Crossley all picked Dewey over Truman. That failure pushed pollsters toward probability sampling, in which every person in the population has a known chance of being picked, instead of quotas filled by interviewers.
Over the longer run, the American Presidency Project’s table of Gallup’s final presidential polls from 1936 to 2012 shows misses of 0.1 to 6.0 points on the winner’s share of all votes. That table counts 1936 as 5.1 points on its mixed basis. On the two-party basis Gallup actually forecast, his 1936 miss was 6.8.
The 1936 lesson in today’s polls
View the data table
| Outcome | |
|---|---|
| Literary Digest mail ballots, 1936 | 24 |
| Pew telephone surveys, 2018 | 6 |
The Digest’s 24% response rate sounds dismal. Modern phone polls do worse. Pew Research Center’s telephone surveys had a 7% response rate in 2017 and 6% in 2018. Today’s pollsters live full time with the problem that did most of the damage to the Digest: the people who answer may not be like the people who don’t.
What keeps them afloat is the step the Digest skipped. Pollsters weight their results to known facts about the population, the same kind of fix that Lohr and Brick showed would have flipped the Digest’s call to Roosevelt. A small sample is not the weak point. One 1,000-person poll reaches about 1 in 267,000 adults and can still work. The adjustment is where polls succeed or fail.
So when you read a poll, skip the sample size and ask two questions:
- Who answered? In Lusinchi’s reanalysis, 13.7 of the Digest’s 19.6-point miss came from who mailed ballots back, and the other 5.9 from who was on the mailing lists.
- How were the results adjusted? Weighting by 1932 vote would have turned the Digest’s 161 Roosevelt electoral votes into 276.
A poll that can answer both deserves more of your trust than one that can only tell you how big it was.